Download
1 / 1
10 likes | 93 Views
This project analyzes the Upper Iowa River's flow and the severity of the "hundred-year flood" using rainfall data. Thirteen gauges measure rainfall in the catchment areas, with GLUE method predicting likely flow values. The study utilizes TOPModel Rainfall-Runoff Calculations, managing uncertainty and deriving efficiency scores. Various parameters and initial conditions are considered, and a rainfall time series event is defined to estimate the one-percent annual event. The study partitions the river watershed, fitting event data to a gamma PDF function and accounting for moisture storage and flux within hydrological similarity groups. Observations from probability plots inform the flow projections for the one-percent annual event.

E N D
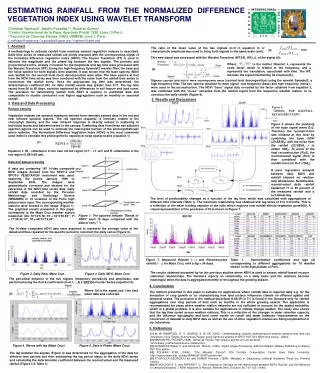
ESTIMATING THE 100-YEAR FLOOD FORDECORAH USING THE RAINFALL EVENTS OF THE RIVER'S CATCHMENT By Kai Tsuruta Faculty Advisor: Richard Bernatz Generalized Likelihood Uncertainty Estimate (GLUE) Abstract:This project estimated the flow in the Upper Iowa River and the severity of the “hundred-year flood.” Thirteen gauges were placed throughout areas whose rainfall ran into the river and were north of Decorah to measure the amount of rain from an event and the time it occurred. Using gauge data an interpolation method estimated rainfall for the whole catchment. Next a computer program, GLUE, randomly assigned values within a range of likely values to variables associated with runoff and predicted a flow. Over several trials this gave a distribution of values that the flow was likely within. To calculate the “hundred year flood” the events were fitted to a suitable distribution and the largest event with a 1% chance of occurring annually was found. The largest event of July was replaced with the calculated event and GLUE was run, giving the range of likely flow values for the flood. TOPModel Rainfall-Runoff Calculations • The GLUE method manages the uncertainty in these values in the following way: • Rejects the idea there is an optimum parameter set • Establishes reasonable intervals for each parameter and initial condition based on physical reasoning or observation • Uses multiple TOPModel runs in which parameter values randomly chosen from the specified intervals • Calculates an efficiency score based on a Nash-Sutcliff measure for each run • Collects all “behavior” run output to establish percentile boundaries on the outcomes. • TOPModel flow calculations require: • Rainfall input • Initial conditions for sub-soil and root zone moisture • Seven parameter values (soil transmissivity, etc…) For each subcatchment, the 30-meter by 30-meter elements are grouped according to their hydrological similarity index, the ratio of upslope drainage area and element slope. The figure above shows the distribution of element indices for the Ten Mile Creek subcatchment. Red indicated high and dry elements, blue indicates low and wet. Estimating the One-Percent Annual Event Generating a Rainfall Time Series Event Definition: A rainfall event begins when at least 0.02 inches is recorded among all gauges in a 15-minute interval. An event continues as long as at least 0.02 of an inch is recorded among all gauges in a 15-minute interval without more than 12 hours elapsing between non-event intervals For efficiency sake, flow calculations are made on each of the 30 hydrological similarity groups instead of each element, assuming elements within the same HSG will react similarly to a rainfall event. The Upper Iowa River watershed is approximately 1395 square kilometers (540 square miles) in size. The watershed upstream from Decorah is partitioned into 31 subwatersheds defined, mostly, by tributaries to the Upper Iowa River. Two possible event probability density functions are considered: exponential and gamma. The lack of a “zero” event lead to fitting the event data with a gamma pdf The figure above shows the conceptual model used to account for moisture storage and flux within each HSG. • Basic TOPModel Storage and Flow Variables: • S(t) = Average Saturation Deficit (Length) • = flow from the unsaturated zone to the saturated zone (Length/Time) • where i is the hydrologic similarity group (HSG) index, and is the percentage of subcatchment area associated with the HSG. • = flow from the saturated zone to the stream • where S(t-1) is the average subcatchment storage deficit from the previous time, and m is a parameter specifying the rate of decrease of transmissivity with increasing storage deficit. for x > 0. Values for and are determined using the method of maximum likelihood estimation. Rain gauge data is interpolated to create rainfall surfaces for each 15-minute interval of a rainfall event. Probability plot of observed data versus a theoretical sample generated from the fitted gamma pdf. The rainfall surfaces are used to construct a quarter hour rainfall time series for each subcatchment for the convective season. The projected flow due to the one-percent annual event is shown above. The blue and green curves represent the 5th- and 95th-percentile flows, respectively. The black curve is the observed discharge for the Upper Iowa River. The one-percent annual event is determined from the probability density function given above. It replaces an observed event in the 2004 time series. The projected discharge interval for the 1%-annual event is 7,200 to 23,700 cfs.