Download
1 / 52
1.12k likes | 2.09k Views
Test Bank for Business Analytics 3rd Edition by Jeffrey D. Camm

E N D
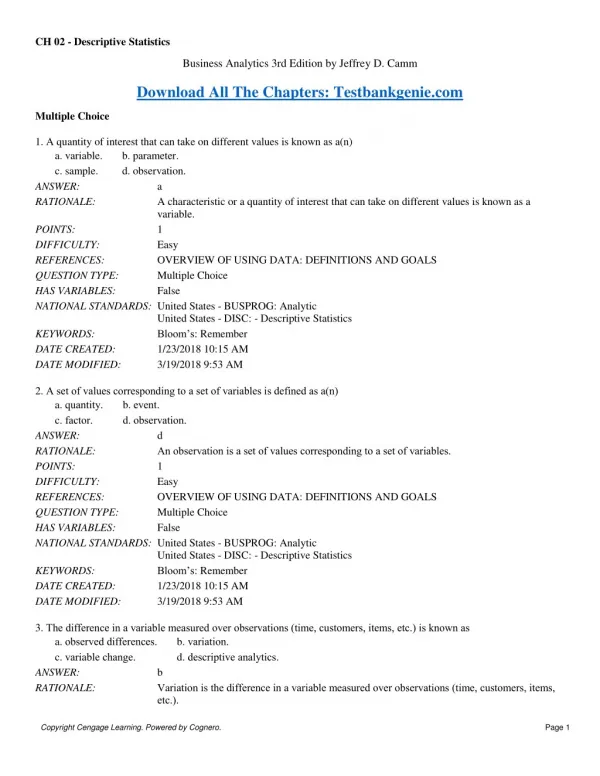
CH 02 - Descriptive Statistics Business Analytics 3rd Edition by Jeffrey D. Camm Download All The Chapters: Testbankgenie.com Multiple Choice 1. A quantity of interest that can take on different values is known as a(n) a. variable. b. parameter. c. sample. d. observation. ANSWER: a RATIONALE: A characteristic or a quantity of interest that can take on different values is known as a variable. POINTS: 1 DIFFICULTY: Easy REFERENCES: OVERVIEW OF USING DATA: DEFINITIONS AND GOALS QUESTION TYPE: Multiple Choice HAS VARIABLES: False NATIONAL STANDARDS: United States - BUSPROG: Analytic United States - DISC: - Descriptive Statistics KEYWORDS: Bloom’s: Remember DATE CREATED: 1/23/2018 10:15 AM DATE MODIFIED: 3/19/2018 9:53 AM 2. A set of values corresponding to a set of variables is defined as a(n) a. quantity. b. event. c. factor. d. observation. ANSWER: d RATIONALE: An observation is a set of values corresponding to a set of variables. POINTS: 1 DIFFICULTY: Easy REFERENCES: OVERVIEW OF USING DATA: DEFINITIONS AND GOALS QUESTION TYPE: Multiple Choice HAS VARIABLES: False NATIONAL STANDARDS: United States - BUSPROG: Analytic United States - DISC: - Descriptive Statistics KEYWORDS: Bloom’s: Remember DATE CREATED: 1/23/2018 10:15 AM DATE MODIFIED: 3/19/2018 9:53 AM 3. The difference in a variable measured over observations (time, customers, items, etc.) is known as a. observed differences. b. variation. c. variable change. d. descriptive analytics. ANSWER: b RATIONALE: Variation is the difference in a variable measured over observations (time, customers, items, etc.). Copyright Cengage Learning. Powered by Cognero. Page 1
CH 02 - Descriptive Statistics POINTS: DIFFICULTY: REFERENCES: QUESTION TYPE: HAS VARIABLES: NATIONAL STANDARDS: United States - BUSPROG: Analytic United States - DISC: - Descriptive Statistics KEYWORDS: Bloom’s: Remember DATE CREATED: 1/23/2018 10:15 AM DATE MODIFIED: 3/19/2018 9:53 AM 4. _______________ acts as a representative of the population. a. The variable b. The variance c. A sample d. A random variable ANSWER: c RATIONALE: A subset of the population is known as a sample, and acts as a representative of the population. POINTS: 1 DIFFICULTY: Easy REFERENCES: TYPES OF DATA QUESTION TYPE: Multiple Choice HAS VARIABLES: False NATIONAL STANDARDS: United States - BUSPROG: Analytic United States - DISC: - Descriptive Statistics KEYWORDS: Bloom’s: Remember DATE CREATED: 1/23/2018 10:15 AM DATE MODIFIED: 3/19/2018 9:53 AM 5. The act of collecting data that are representative of the population data is called a. random sampling. b. sample data. c. population sampling. d. sources of data. ANSWER: a RATIONALE: A representative sample can be gathered by random sampling of the population data. POINTS: 1 DIFFICULTY: Easy REFERENCES: TYPES OF DATA QUESTION TYPE: Multiple Choice HAS VARIABLES: False NATIONAL STANDARDS: United States - BUSPROG: Analytic United States - DISC: - Descriptive Statistics KEYWORDS: Bloom’s: Remember DATE CREATED: 1/23/2018 10:15 AM DATE MODIFIED: 3/19/2018 9:53 AM 6. The letter grades (A, B, C, D, F) of business analysis students are recorded by a professor. This variable’s classification 1 Moderate OVERVIEW OF USING DATA: DEFINITIONS AND GOALS Multiple Choice False Copyright Cengage Learning. Powered by Cognero. Page 2
CH 02 - Descriptive Statistics a. is quantitative data. c. is categorical data. ANSWER: RATIONALE: POINTS: DIFFICULTY: REFERENCES: QUESTION TYPE: HAS VARIABLES: NATIONAL STANDARDS: United States - BUSPROG: Analytic United States - DISC: - Descriptive Statistics KEYWORDS: Bloom’s: Apply DATE CREATED: 1/23/2018 10:15 AM DATE MODIFIED: 3/19/2018 9:53 AM 7. The amount of time taken by each of 10 students in a class to complete an exam is an example of what type of data? a. Cannot be determined b. Categorical data c. Time series data d. Quantitative data ANSWER: d RATIONALE: Data are considered quantitative data if numeric and arithmetic operations, such as addition, subtraction, multiplication, and division, can be performed on them. POINTS: 1 DIFFICULTY: Easy REFERENCES: TYPES OF DATA QUESTION TYPE: Multiple Choice HAS VARIABLES: False NATIONAL STANDARDS: United States - BUSPROG: Analytic United States - DISC: - Descriptive Statistics KEYWORDS: Bloom’s: Remember DATE CREATED: 1/23/2018 10:15 AM DATE MODIFIED: 3/19/2018 9:53 AM 8. __________ are collected from several entities at the same point in time. a. Time series data b. Categorical and quantitative data c. Cross-sectional data d. Random data ANSWER: c RATIONALE: Cross-sectional data are collected from several entities at the same, or approximately the same, point in time. POINTS: 1 DIFFICULTY: Moderate REFERENCES: TYPES OF DATA QUESTION TYPE: Multiple Choice HAS VARIABLES: False NATIONAL STANDARDS: United States - BUSPROG: Analytic b. cannot be determined. d. is time series data. c If arithmetic operations cannot be performed on the data, they are considered categorical data. 1 Easy TYPES OF DATA Multiple Choice False Copyright Cengage Learning. Powered by Cognero. Page 3
CH 02 - Descriptive Statistics United States - DISC: - Descriptive Statistics Bloom’s: Remember 1/23/2018 10:15 AM 3/19/2018 9:53 AM KEYWORDS: DATE CREATED: DATE MODIFIED: 9. Data collected from several entities over a period of time (minutes, hours, days, etc.) are called a. categorical and quantitative data. b. time series data. c. source data. d. cross-sectional data. ANSWER: b RATIONALE: Data that are collected over a period of time (minutes, hours, days, months, years, etc.) are known as time series data. POINTS: 1 DIFFICULTY: Easy REFERENCES: TYPES OF DATA QUESTION TYPE: Multiple Choice HAS VARIABLES: False NATIONAL STANDARDS: United States - BUSPROG: Analytic United States - DISC: - Descriptive Statistics KEYWORDS: Bloom’s: Remember DATE CREATED: 1/23/2018 10:15 AM DATE MODIFIED: 3/19/2018 9:53 AM 10. In a(n) __________, one or more variables are identified and controlled or manipulated so that data can be obtained about how they influence the variable of interest identified first. a. experimental study b. observational study c. categorical study d. variable study ANSWER: a RATIONALE: In an experimental study, a variable of interest is first identified. Then one or more other variables are identified and controlled or manipulated so that data can be obtained about how they influence the variable of interest. POINTS: 1 DIFFICULTY: Easy REFERENCES: TYPES OF DATA QUESTION TYPE: Multiple Choice HAS VARIABLES: False NATIONAL STANDARDS: United States - BUSPROG: Analytic United States - DISC: - Descriptive Statistics KEYWORDS: Bloom’s: Remember DATE CREATED: 1/23/2018 10:15 AM DATE MODIFIED: 3/19/2018 9:53 AM 11. The data collected from the customers in restaurants about the quality of food is an example of a(n) a. variable study. b. cross-sectional study. c. experimental study. d. observational study. ANSWER: d Copyright Cengage Learning. Powered by Cognero. Page 4
CH 02 - Descriptive Statistics RATIONALE: Nonexperimental, or observational, studies make no attempt to control the variables of interest. Some restaurants use observational studies to obtain data about customer opinions on the quality of food, quality of service, atmosphere, and so on. 1 Moderate TYPES OF DATA Multiple Choice False NATIONAL STANDARDS: United States - BUSPROG: Analytic United States - DISC: - Descriptive Statistics KEYWORDS: Bloom’s: Apply DATE CREATED: 1/23/2018 10:16 AM DATE MODIFIED: 3/19/2018 9:53 AM 12. When working with large spreadsheets with many rows of data, it can be helpful to __________ the data to better find, view, or manage subsets of data. a. split b. sort and filter c. chart d. manipulate ANSWER: b RATIONALE: Excel contains an option to sort and filter data so that one can identify patterns of the data more easily. POINTS: 1 DIFFICULTY: Easy REFERENCES: MODIFYING DATA IN EXCEL QUESTION TYPE: Multiple Choice HAS VARIABLES: False NATIONAL STANDARDS: United States - BUSPROG: Analytic United States - DISC: - Descriptive Statistics KEYWORDS: Bloom’s: Understand DATE CREATED: 1/23/2018 10:16 AM DATE MODIFIED: 3/19/2018 9:53 AM 13. When working with data sets in Excel, __________ can be used to automatically highlight cells that meet specified requirements. a. averaging b. conditional formatting c. summing d. sorting ANSWER: b RATIONALE: Conditional formatting in Excel can make it easy to identify data that satisfy certain conditions in a data set. POINTS: 1 DIFFICULTY: Easy REFERENCES: MODIFYING DATA IN EXCEL QUESTION TYPE: Multiple Choice HAS VARIABLES: False NATIONAL STANDARDS: United States - BUSPROG: Analytic POINTS: DIFFICULTY: REFERENCES: QUESTION TYPE: HAS VARIABLES: Copyright Cengage Learning. Powered by Cognero. Page 5
CH 02 - Descriptive Statistics United States - DISC: - Descriptive Statistics Bloom’s: Understand 3/8/2018 8:52 AM 3/19/2018 9:53 AM KEYWORDS: DATE CREATED: DATE MODIFIED: 14. A summary of data that shows the number of observations in each of several nonoverlapping bins is called a(n) a. frequency distribution. b. sample summary. c. bin distribution. d. observed distribution. ANSWER: a RATIONALE: A frequency distribution is a summary of data that shows the number (frequency) of observations in each of several nonoverlapping classes, typically referred to as bins, when dealing with distributions. POINTS: 1 DIFFICULTY: Easy REFERENCES: CREATING DISTRIBUTIONS FROM DATA QUESTION TYPE: Multiple Choice HAS VARIABLES: False NATIONAL STANDARDS: United States - BUSPROG: Analytic United States - DISC: - Descriptive Statistics KEYWORDS: Bloom’s: Remember DATE CREATED: 1/23/2018 10:16 AM DATE MODIFIED: 3/19/2018 9:53 AM 15. Which of the following gives the proportion of items in each bin? a. Frequency b. Class size c. Relative frequency d. Bin proportion ANSWER: c RATIONALE: The relative frequency of a bin equals the fraction or proportion of items belonging to a class. POINTS: 1 DIFFICULTY: Easy REFERENCES: CREATING DISTRIBUTIONS FROM DATA QUESTION TYPE: Multiple Choice HAS VARIABLES: False NATIONAL STANDARDS: United States - BUSPROG: Analytic United States - DISC: - Descriptive Statistics KEYWORDS: Bloom’s: Remember DATE CREATED: 1/23/2018 10:16 AM DATE MODIFIED: 3/19/2018 9:53 AM 16. Compute the relative frequencies for the data given in the table below: Number of students A 16 B 28 Grades Copyright Cengage Learning. Powered by Cognero. Page 6
CH 02 - Descriptive Statistics C D Total a. 0.31, 0.14, 0.37, 0.18 c. 0.16, 0.28, 0.33, 0.13 ANSWER: RATIONALE: 33 13 90 b. 0.37, 0.14, 0.31, 0.18 d. 0.18, 0.31, 0.37, 0.14 d The relative frequency of a bin equals the fraction or proportion of items belonging to a class. Relative frequency of a bin = Frequency of the bin /n. 1 Moderate CREATING DISTRIBUTIONS FROM DATA Multiple Choice False NATIONAL STANDARDS: United States - BUSPROG: Analytic United States - DISC: - Descriptive Statistics KEYWORDS: Bloom’s: Apply DATE CREATED: 1/23/2018 10:16 AM DATE MODIFIED: 4/27/2018 9:35 AM 17. Consider the data below. What percentage of students scored grade C? Number of students A 16 B 28 C 33 D 13 Total 90 a. 33% b. 31% c. 37% d. 28% ANSWER: c RATIONALE: A percent frequency distribution summarizes the percent frequency of the data for each bin. The percent frequency of a bin is the relative frequency multiplied by 100. 33/90 = 37%. POINTS: 1 DIFFICULTY: Moderate REFERENCES: CREATING DISTRIBUTIONS FROM DATA QUESTION TYPE: Multiple Choice HAS VARIABLES: False NATIONAL STANDARDS: United States - BUSPROG: Analytic United States - DISC: - Descriptive Statistics KEYWORDS: Bloom’s: Apply DATE CREATED: 1/23/2018 10:16 AM DATE MODIFIED: 4/27/2018 9:37 AM 18. Which of the following are necessary to be determined to define the classes for a frequency distribution with quantitative data? a. Number of nonoverlapping bins, width of each bin, and bin limits POINTS: DIFFICULTY: REFERENCES: QUESTION TYPE: HAS VARIABLES: Grades Copyright Cengage Learning. Powered by Cognero. Page 7
CH 02 - Descriptive Statistics b. Width of each bin and bin lower limits c. Number of overlapping bins, width of each bin, and bin upper limits d. Width of each bin and number of bins ANSWER: a RATIONALE: The three steps necessary to define the classes for a frequency distribution with quantitative data are: determine the number of nonoverlapping bins, determine the width of each bin, and determine the bin limits. POINTS: 1 DIFFICULTY: Moderate REFERENCES: CREATING DISTRIBUTIONS FROM DATA QUESTION TYPE: Multiple Choice HAS VARIABLES: False NATIONAL STANDARDS: United States - BUSPROG: Analytic United States - DISC: - Descriptive Statistics KEYWORDS: Bloom’s: Understand DATE CREATED: 1/23/2018 10:16 AM DATE MODIFIED: 3/19/2018 9:53 AM 19. The goal regarding using an appropriate number of bins is to show the a. number of observations. b. number of variables. c. variation in the data. d. correlation in the data. ANSWER: c RATIONALE: The goal is to use enough bins to show the variation in the data, but not so many classes that some contain only a few data items. POINTS: 1 DIFFICULTY: Moderate REFERENCES: CREATING DISTRIBUTIONS FROM DATA QUESTION TYPE: Multiple Choice HAS VARIABLES: False NATIONAL STANDARDS: United States - BUSPROG: Analytic United States - DISC: - Descriptive Statistics KEYWORDS: Bloom’s: Understand DATE CREATED: 1/23/2018 10:16 AM DATE MODIFIED: 3/19/2018 9:53 AM 20. A __________ is a graphical summary of data previously summarized in a frequency distribution. a. box plot b. histogram c. line chart d. scatter chart ANSWER: b RATIONALE: A common graphical presentation of quantitative data is a histogram. This graphical summary can be prepared for data previously summarized in a frequency, a relative frequency, or a percent frequency distribution. POINTS: 1 DIFFICULTY: Easy REFERENCES: CREATING DISTRIBUTIONS FROM DATA Copyright Cengage Learning. Powered by Cognero. Page 8
CH 02 - Descriptive Statistics QUESTION TYPE: HAS VARIABLES: NATIONAL STANDARDS: United States - BUSPROG: Analytic United States - DISC: - Descriptive Statistics KEYWORDS: Bloom’s: Remember DATE CREATED: 1/23/2018 10:16 AM DATE MODIFIED: 3/19/2018 9:53 AM 21. Identify the shape of the distribution in the figure below. Multiple Choice False a. Skewed left c. Approximately bell shaped ANSWER: RATIONALE: b. Symmetric d. Skewed right d A histogram is said to be skewed to the right if its tail extends farther to the right than to the left. The given histogram is skewed to the right. 1 Moderate CREATING DISTRIBUTIONS FROM DATA Multiple Choice False NATIONAL STANDARDS: United States - BUSPROG: Analytic United States - DISC: - Descriptive Statistics KEYWORDS: Bloom’s: Remember DATE CREATED: 1/23/2018 10:16 AM DATE MODIFIED: 3/19/2018 9:53 AM 22. The __________ shows the number of data items with values less than or equal to the upper class limit of each class. a. cumulative frequency distribution b. frequency distribution c. percent frequency distribution d. relative frequency distribution ANSWER: a RATIONALE: The cumulative frequency distribution shows the number of data items with values less than or equal to the upper class limit of each class. POINTS: 1 POINTS: DIFFICULTY: REFERENCES: QUESTION TYPE: HAS VARIABLES: Copyright Cengage Learning. Powered by Cognero. Page 9
CH 02 - Descriptive Statistics DIFFICULTY: REFERENCES: QUESTION TYPE: HAS VARIABLES: NATIONAL STANDARDS: United States - BUSPROG: Analytic United States - DISC: - Descriptive Statistics KEYWORDS: Bloom’s: Remember DATE CREATED: 1/23/2018 10:16 AM DATE MODIFIED: 3/19/2018 9:53 AM 23. The __________ is a point estimate of the population mean for the variable of interest. a. sample mean b. median c. sample d. geometric mean ANSWER: a RATIONALE: The sample mean is a point estimate of the (typically unknown) population mean for the variable of interest. POINTS: 1 DIFFICULTY: Moderate REFERENCES: MEASURES OF LOCATION QUESTION TYPE: Multiple Choice HAS VARIABLES: False NATIONAL STANDARDS: United States - BUSPROG: Analytic United States - DISC: - Descriptive Statistics KEYWORDS: Bloom’s: Remember DATE CREATED: 1/23/2018 10:16 AM DATE MODIFIED: 3/19/2018 9:53 AM 24. Compute the mean of the following data. 56, 42, 37, 29, 45, 51, 30, 25, 34, 57 a. 42.8 b. 52.1 c. 40.6 d. 39.4 ANSWER: c RATIONALE: The mean provides a measure of central location for the data. It is computed as: Easy CREATING DISTRIBUTIONS FROM DATA Multiple Choice False 1 Moderate MEASURES OF LOCATION Multiple Choice False POINTS: DIFFICULTY: REFERENCES: QUESTION TYPE: HAS VARIABLES: NATIONAL STANDARDS: United States - BUSPROG: Analytic Copyright Cengage Learning. Powered by Cognero. Page 10
CH 02 - Descriptive Statistics United States - DISC: - Descriptive Statistics Bloom’s: Apply 1/23/2018 10:16 AM 3/19/2018 9:53 AM KEYWORDS: DATE CREATED: DATE MODIFIED: 25. Compute the median of the following data. 32, 41, 36, 24, 29, 30, 40, 22, 25, 37 a. 28 b. 31 c. 40 d. 34 ANSWER: RATIONALE: b The median is the value in the middle when the data are arranged in ascending order (smallest to largest value). The sorted data are 22, 24, 25, 29, 30, 32, 36, 37, 40, 41. The median, in this case, is the average of the middle two values. 1 Moderate MEASURES OF LOCATION Multiple Choice False POINTS: DIFFICULTY: REFERENCES: QUESTION TYPE: HAS VARIABLES: NATIONAL STANDARDS: United States - BUSPROG: Analytic United States - DISC: - Descriptive Statistics KEYWORDS: Bloom’s: Apply DATE CREATED: 1/23/2018 10:16 AM DATE MODIFIED: 3/30/2018 9:38 AM 26. Compute the mode for the following data. 12, 16, 19, 10, 12, 11, 21, 12, 21, 10 a. 21 b. 11 c. 12 d. 10 ANSWER: c RATIONALE: The mode is the value that occurs most frequently in a data set. The value 12 occurs with the greatest frequency. Therefore, the mode is 12. POINTS: 1 DIFFICULTY: Moderate REFERENCES: MEASURES OF LOCATION QUESTION TYPE: Multiple Choice HAS VARIABLES: False NATIONAL STANDARDS: United States - BUSPROG: Analytic United States - DISC: - Descriptive Statistics KEYWORDS: Bloom’s: Apply Copyright Cengage Learning. Powered by Cognero. Page 11
CH 02 - Descriptive Statistics DATE CREATED: DATE MODIFIED: 27. Compute the geometric mean for the following data on growth factors of an investment for 10 years. 1.10, 0.50, 0.70, 1.21, 1.25, 1.12, 1.16, 1.11, 1.13, 1.22 a. 1.0221 b. 1.0148 c. 1.0363 d. 1.1475 ANSWER: b RATIONALE: The geometric mean is a measure of location that is calculated by finding the nth root of the product of n values. 1/23/2018 10:16 AM 3/19/2018 9:53 AM 1 Moderate MEASURES OF LOCATION Multiple Choice False United States - BUSPROG: Analytic United States - DISC: - Descriptive Statistics Bloom’s: Apply 1/23/2018 10:16 AM 3/19/2018 9:53 AM POINTS: DIFFICULTY: REFERENCES: QUESTION TYPE: HAS VARIABLES: NATIONAL STANDARDS: KEYWORDS: DATE CREATED: DATE MODIFIED: 28. The simplest measure of variability is the a. variance. c. coefficient of variation. ANSWER: RATIONALE: POINTS: DIFFICULTY: REFERENCES: QUESTION TYPE: HAS VARIABLES: NATIONAL STANDARDS: United States - BUSPROG: Analytic United States - DISC: - Descriptive Statistics KEYWORDS: Bloom’s: Remember DATE CREATED: 1/23/2018 10:16 AM DATE MODIFIED: 3/19/2018 9:53 AM 29. The variance is based on the a. deviation about the median. c. deviation about the mean. ANSWER: c RATIONALE: The variance is based on the deviation about the mean, which is the difference between the b. standard deviation. d. range. d The simplest measure of variability is the range. 1 Easy MEASURES OF VARIABILITY Multiple Choice False b. number of variables. d. correlation in the data. Copyright Cengage Learning. Powered by Cognero. Page 12
CH 02 - Descriptive Statistics value of each observation (xi) and the mean. 1 Easy MEASURES OF VARIABILITY Multiple Choice False POINTS: DIFFICULTY: REFERENCES: QUESTION TYPE: HAS VARIABLES: NATIONAL STANDARDS: United States - BUSPROG: Analytic United States - DISC: - Descriptive Statistics KEYWORDS: Bloom’s: Remember DATE CREATED: 1/23/2018 10:16 AM DATE MODIFIED: 3/19/2018 9:53 AM 30. Use technology to compute the standard deviation for the following sample data. 32, 41, 36, 24, 29, 30, 40, 22, 25, 37 a. 5.96 b. 6.41 c. 5.42 d. 6.75 ANSWER: d RATIONALE: The standard deviation is defined to be the positive square root of the variance and can be calculated using the Excel function =STDEV.S( ). POINTS: 1 DIFFICULTY: Moderate REFERENCES: MEASURES OF VARIABILITY QUESTION TYPE: Multiple Choice HAS VARIABLES: False NATIONAL STANDARDS: United States - BUSPROG: Analytic United States - DISC: - Descriptive Statistics KEYWORDS: Bloom’s: Apply DATE CREATED: 1/23/2018 10:16 AM DATE MODIFIED: 3/19/2018 9:53 AM 31. Compute the coefficient of variation for the following sample data. 32, 41, 36, 24, 29, 30, 40, 22, 25, 37 a. 18.64% b. 21.36% c. 20.28% d. 21.67% ANSWER: b RATIONALE: The coefficient of variation indicates how large the standard deviation is relative to the mean. The coefficient of variation is (6.75 / 31.6 × 100) = 21.36%. POINTS: 1 DIFFICULTY: Moderate REFERENCES: MEASURES OF VARIABILITY QUESTION TYPE: Multiple Choice HAS VARIABLES: False Copyright Cengage Learning. Powered by Cognero. Page 13
CH 02 - Descriptive Statistics NATIONAL STANDARDS: United States - BUSPROG: Analytic United States - DISC: - Descriptive Statistics KEYWORDS: Bloom’s: Apply DATE CREATED: 1/23/2018 10:16 AM DATE MODIFIED: 3/19/2018 9:53 AM 32. Compute the 50th percentile for the following data. 10, 15, 17, 21, 25, 12, 16, 11, 13, 22 a. 18.6 b. 13.3 c. 15.5 d. 17.7 ANSWER: c RATIONALE: A percentile is the value of a variable at which a specified (approximate) percentage of observations are below that value. The 50thpercentile is the median. The sorted data are 10, 11, 12, 13, 15, 16, 17, 21, 22, 25. In this case the median is the average of the middle two numbers. Median = 1 Moderate ANALYZING DISTRIBUTIONS Multiple Choice False POINTS: DIFFICULTY: REFERENCES: QUESTION TYPE: HAS VARIABLES: NATIONAL STANDARDS: United States - BUSPROG: Analytic United States - DISC: - Descriptive Statistics KEYWORDS: Bloom’s: Apply DATE CREATED: 1/23/2018 10:16 AM DATE MODIFIED: 3/30/2018 9:50 AM 33. Compute the third quartile for the following data. 10, 15, 17, 21, 25, 12, 16, 11, 13, 22 a. 21.25 b. 15.5 c. 21.5 d. 11.75 ANSWER: a RATIONALE: Quartiles divide data into four parts, with each part containing approximately one-fourth, or 25 percent, of the observations. This can be calculated with the Excel function =QUARTILE.EXC(range,3) = 21.25. POINTS: 1 DIFFICULTY: Moderate REFERENCES: ANALYZING DISTRIBUTIONS QUESTION TYPE: Multiple Choice HAS VARIABLES: False NATIONAL STANDARDS: United States - BUSPROG: Analytic Copyright Cengage Learning. Powered by Cognero. Page 14
CH 02 - Descriptive Statistics United States - DISC: - Descriptive Statistics Bloom’s: Apply 1/23/2018 10:16 AM 3/28/2018 2:42 PM KEYWORDS: DATE CREATED: DATE MODIFIED: 34. Compute the IQR for the following data. 10, 15, 17, 21, 25, 12, 16, 11, 13, 22 a. 6.25 b. 7.75 c. 5.14 d. 9.50 ANSWER: RATIONALE: d The difference between the third and first quartiles is often referred to as the interquartile range, or IQR. IQR = 21.25 – 11.75 = 9.50. 1 Moderate ANALYZING DISTRIBUTIONS Multiple Choice False NATIONAL STANDARDS: United States - BUSPROG: Analytic United States - DISC: - Descriptive Statistics KEYWORDS: Bloom’s: Apply DATE CREATED: 1/23/2018 10:16 AM DATE MODIFIED: 3/19/2018 9:53 AM 35. A __________ determines how far a particular value is from the mean relative to the data set’s standard deviation. a. coefficient of variation b. z-score c. variance d. percentile ANSWER: b RATIONALE: A z-score helps us determine how far a particular value is from the mean relative to the data set’s standard deviation. POINTS: 1 DIFFICULTY: Easy REFERENCES: ANALYZING DISTRIBUTIONS QUESTION TYPE: Multiple Choice HAS VARIABLES: False NATIONAL STANDARDS: United States - BUSPROG: Analytic United States - DISC: - Descriptive Statistics KEYWORDS: Bloom’s: Remember DATE CREATED: 1/23/2018 10:16 AM DATE MODIFIED: 3/19/2018 9:53 AM 36. For data having a bell-shaped distribution, approximately __________ percent of the data values will be within one standard deviation of the mean. a. 95 b. 66 c. 68 d. 97 POINTS: DIFFICULTY: REFERENCES: QUESTION TYPE: HAS VARIABLES: Copyright Cengage Learning. Powered by Cognero. Page 15
CH 02 - Descriptive Statistics ANSWER: RATIONALE: c Approximately 68 percent of the data values will be within one standard deviation of the mean for data having a bell-shaped distribution. 1 Easy ANALYZING DISTRIBUTIONS Multiple Choice False NATIONAL STANDARDS: United States - BUSPROG: Analytic United States - DISC: - Descriptive Statistics KEYWORDS: Bloom’s: Remember DATE CREATED: 1/23/2018 10:16 AM DATE MODIFIED: 3/19/2018 9:53 AM 37. Any data value with a z-score less than –3 or greater than +3 is considered to be a(n) a. outlier. b. statistic. c. whisker. d. z-score value. ANSWER: a RATIONALE: Any data value with a z-score less than –3 or greater than +3 is treated as an outlier. POINTS: 1 DIFFICULTY: Easy REFERENCES: ANALYZING DISTRIBUTIONS QUESTION TYPE: Multiple Choice HAS VARIABLES: False NATIONAL STANDARDS: United States - BUSPROG: Analytic United States - DISC: - Descriptive Statistics KEYWORDS: Bloom’s: Remember DATE CREATED: 1/23/2018 10:16 AM DATE MODIFIED: 3/19/2018 9:53 AM 38. Which of the following graphs provides information on outliers and IQR of a data set? a. Histogram b. Line chart c. Scatter chart d. Box plot ANSWER: d RATIONALE: A box plot is a graphical summary of the distribution of data, and it is developed from the quartiles for a data set. Therefore, the information on the outliers and IQR can be obtained from a box plot. POINTS: 1 DIFFICULTY: Easy REFERENCES: ANALYZING DISTRIBUTIONS QUESTION TYPE: Multiple Choice HAS VARIABLES: False NATIONAL STANDARDS: United States - BUSPROG: Analytic United States - DISC: - Descriptive Statistics KEYWORDS: Bloom’s: Understand POINTS: DIFFICULTY: REFERENCES: QUESTION TYPE: HAS VARIABLES: Copyright Cengage Learning. Powered by Cognero. Page 16
CH 02 - Descriptive Statistics DATE CREATED: DATE MODIFIED: 39. If covariance between two variables is near 0, it implies that a. a positive relationship exists between the variables. b. the variables are not linearly related. c. the variables are negatively related. d. the variables are strongly related. ANSWER: b RATIONALE: If the covariance between two variables is near 0, then the variables are not linearly related. POINTS: 1 DIFFICULTY: Easy REFERENCES: MEASURES OF ASSOCIATION BETWEEN TWO VARIABLES QUESTION TYPE: Multiple Choice HAS VARIABLES: False NATIONAL STANDARDS: United States - BUSPROG: Analytic United States - DISC: - Descriptive Statistics KEYWORDS: Bloom’s: Understand DATE CREATED: 1/23/2018 10:16 AM DATE MODIFIED: 3/19/2018 9:53 AM 40. The correlation coefficient will always take values a. greater than 0. b. between –1 and 0. c. between –1 and +1. d. less than –1. ANSWER: c RATIONALE: The correlation coefficient will always take values between –1 and +1. POINTS: 1 DIFFICULTY: Easy REFERENCES: MEASURES OF ASSOCIATION BETWEEN TWO VARIABLES QUESTION TYPE: Multiple Choice HAS VARIABLES: False NATIONAL STANDARDS: United States - BUSPROG: Analytic United States - DISC: - Descriptive Statistics KEYWORDS: Bloom’s: Remember DATE CREATED: 1/23/2018 10:16 AM DATE MODIFIED: 3/19/2018 9:53 AM 41. Scores on Ms. Bond's test have a mean of 70 and a standard deviation of 11. Michelle has a score of 48. Convert Michelle's score to a z-score. (Round to two decimal places if necessary.) a. 2 b. 41.64 c. –2 d. 1.33 ANSWER: c RATIONALE: z-score = (value – mean) / standard deviation = (48 – 70) / 11 = –2 1/23/2018 10:16 AM 3/19/2018 9:53 AM Copyright Cengage Learning. Powered by Cognero. Page 17
CH 02 - Descriptive Statistics POINTS: DIFFICULTY: REFERENCES: QUESTION TYPE: HAS VARIABLES: NATIONAL STANDARDS: United States - BUSPROG: Analytic United States - DISC: - Descriptive Statistics KEYWORDS: Bloom’s: Apply DATE CREATED: 1/23/2018 10:16 AM DATE MODIFIED: 3/19/2018 9:53 AM 42. Scores on Ms. Nash's test have a mean of 64 and a standard deviation of 9. Steve has a score of 52. Convert Steve's score to a z-score. (Round to two decimal places if necessary.) a. 1.33 b. 58.2 c. –2 d. –1.33 ANSWER: d RATIONALE: z-score = (value – mean) / standard deviation = (52 – 64) / 9 = –1.33 POINTS: 1 DIFFICULTY: Moderate REFERENCES: ANALYZING DISTRIBUTIONS QUESTION TYPE: Multiple Choice HAS VARIABLES: False NATIONAL STANDARDS: United States - BUSPROG: Analytic United States - DISC: - Descriptive Statistics KEYWORDS: Bloom’s: Apply DATE CREATED: 1/23/2018 10:16 AM DATE MODIFIED: 3/19/2018 9:53 AM 43. Scores on Ms. Bond's test have a mean of 70 and a standard deviation of 11. David has a score of 52 on Ms. Bond's test. Scores on Ms. Nash's test have a mean of 64 and a standard deviation of 6. Steven has a score of 52 on Ms. Nash's test. Which student has the higher standardized score? a. David's standardized score is –1.64 and Steven's standardized score is –2.00. Therefore, David has the higher standardized score. b. David's standardized score is –1.64 and Steven's standardized score is –2.00. Therefore, Steven has the higher standardized score. c. David's standardized score is 1.64 and Steven's standardized score is 2.00. Therefore, Steven has the higher standardized score. d. Cannot be determined with the information provided. ANSWER: b RATIONALE: David's standardized score is (52 – 70) / 11 = –1.64 and Steven's standardized score is (52 – 64) / 6 = –2.00. Therefore, David has the higher standardized score. POINTS: 1 DIFFICULTY: Challenging 1 Moderate ANALYZING DISTRIBUTIONS Multiple Choice False Copyright Cengage Learning. Powered by Cognero. Page 18
CH 02 - Descriptive Statistics REFERENCES: QUESTION TYPE: HAS VARIABLES: NATIONAL STANDARDS: United States - BUSPROG: Analytic United States - DISC: - Descriptive Statistics KEYWORDS: Bloom’s: Apply DATE CREATED: 1/23/2018 10:16 AM DATE MODIFIED: 3/28/2018 2:44 PM 44. The College Board originally scaled SAT scores so that the scores for each section were approximately normally distributed with a mean of 500 and a standard deviation of 100. Assuming scores follow a bell-shaped distribution, use the empirical rule to find the percentage of students who scored greater than 700. a. 97.5% b. 95% c. 2.5% d. 5% ANSWER: c RATIONALE: z-score = (700 – 500) / 100 = 2. Recall that 95% of the observations fall within two standard deviations of the mean, so 2.5% of the observations will fall above 2 standard deviations and 2.5% of observations will fall below –2 standard deviations. 2.5% of students will score greater than 700. POINTS: 1 DIFFICULTY: Moderate REFERENCES: ANALYZING DISTRIBUTIONS QUESTION TYPE: Multiple Choice HAS VARIABLES: False NATIONAL STANDARDS: United States - BUSPROG: Analytic United States - DISC: - Descriptive Statistics KEYWORDS: Bloom’s: Apply DATE CREATED: 1/23/2018 10:16 AM DATE MODIFIED: 3/19/2018 9:53 AM 45. The College Board originally scaled SAT scores so that the scores for each section were approximately normally distributed with a mean of 500 and a standard deviation of 100. Assuming scores follow a bell-shaped distribution, use the empirical rule to find the percentage of students who scored less than 400. a. 16% b. 68% c. 84% d. 32% ANSWER: a RATIONALE: z-score = (400 – 500) / 100 = –1. Recall that 68% of observations fall within one standard deviation of the mean, so 16% of observations will fall in each tail. The percentage of students who scored less than 400 (below –1 standard deviations) is 16%. POINTS: 1 DIFFICULTY: Moderate REFERENCES: ANALYZING DISTRIBUTIONS ANALYZING DISTRIBUTIONS Multiple Choice False Copyright Cengage Learning. Powered by Cognero. Page 19
CH 02 - Descriptive Statistics QUESTION TYPE: HAS VARIABLES: NATIONAL STANDARDS: United States - BUSPROG: Analytic United States - DISC: - Descriptive Statistics KEYWORDS: Bloom’s: Apply DATE CREATED: 1/23/2018 10:16 AM DATE MODIFIED: 3/19/2018 9:53 AM 46. The College Board reported that the mean Math Level 2 SAT subject test score was 686 with a standard deviation of 96. Assuming scores follow a bell-shaped distribution, use the empirical rule to find the percentage of students who scored less than 494. a. 97.5% b. 95% c. 2.5% d. 5% ANSWER: c RATIONALE: z-score = (494 – 686) / 96 = –2. Recall that 95% of observations fall within two standard deviations of the mean, which means 2.5% of observations fall in each tail. Since we want to know the percentage of students who scored less than 494, we essentially want to know the percentage of observations that fall below –2 standard deviations. 2.5% of observations fall below –2 standard deviations. POINTS: 1 DIFFICULTY: Moderate REFERENCES: ANALYZING DISTRIBUTIONS QUESTION TYPE: Multiple Choice HAS VARIABLES: False NATIONAL STANDARDS: United States - BUSPROG: Analytic United States - DISC: - Descriptive Statistics KEYWORDS: Bloom’s: Apply DATE CREATED: 1/23/2018 10:16 AM DATE MODIFIED: 3/28/2018 2:45 PM 47. Compute the relative frequency for students who earned an A shown in the table of grades below. GradesNumber of Students A 10 B 31 C 36 D 6 83 a. 0.12 b. 0.10 c. 0.83 d. Not enough information ANSWER: a RATIONALE: The relative frequency of a bin equals the fraction or proportion of items belonging to a class. Multiple Choice False Copyright Cengage Learning. Powered by Cognero. Page 20
CH 02 - Descriptive Statistics Relative frequency of a bin = frequency of the bin /n. 1 Moderate CREATING DISTRIBUTIONS FROM DATA Multiple Choice False POINTS: DIFFICULTY: REFERENCES: QUESTION TYPE: HAS VARIABLES: NATIONAL STANDARDS: United States - BUSPROG: Analytic United States - DISC: - Descriptive Statistics KEYWORDS: Bloom’s: Apply DATE CREATED: 1/23/2018 10:16 AM DATE MODIFIED: 3/19/2018 9:53 AM 48. Compute the relative frequency for students who earned a C shown in the table of grades below. GradesNumber of Students A 10 B 31 C 36 D 6 83 a. 0.43 b. 0.53 c. 0.83 d. Not enough information ANSWER: a RATIONALE: The relative frequency of a bin equals the fraction or proportion of items belonging to a class. Relative frequency of a bin = frequency of the bin /n. POINTS: 1 DIFFICULTY: Moderate REFERENCES: CREATING DISTRIBUTIONS FROM DATA QUESTION TYPE: Multiple Choice HAS VARIABLES: False NATIONAL STANDARDS: United States - BUSPROG: Analytic United States - DISC: - Descriptive Statistics KEYWORDS: Bloom’s: Apply DATE CREATED: 1/23/2018 10:16 AM DATE MODIFIED: 3/19/2018 9:53 AM 49. Below is a histogram for the number of days that it took Wyche Accounting to perform audits in the last quarter of last year. What is the relative frequency of the 21-24 bin? Copyright Cengage Learning. Powered by Cognero. Page 21
CH 02 - Descriptive Statistics ANSWER: RATIONALE: a. 0.05 b. 0.14 c. 0.25 d. 2.5 c The relative frequency of a bin equals the fraction or proportion of items belonging to a class. Relative frequency of a bin = frequency of the bin /n = 5/20 = 0.25. 1 Moderate CREATING DISTRIBUTIONS FROM DATA Multiple Choice False NATIONAL STANDARDS: United States - BUSPROG: Analytic United States - DISC: - Descriptive Statistics KEYWORDS: Bloom’s: Apply DATE CREATED: 1/23/2018 10:16 AM DATE MODIFIED: 3/28/2018 2:47 PM 50. Below is a histogram for the number of days that it took Wyche Accounting to perform audits in the last quarter of last year. What is the frequency of the 25-28 bin? POINTS: DIFFICULTY: REFERENCES: QUESTION TYPE: HAS VARIABLES: Copyright Cengage Learning. Powered by Cognero. Page 22
CH 02 - Descriptive Statistics ANSWER: RATIONALE: a. 0.05 b. 1 c. 0.5 d. 4 b A frequency distribution is a summary of data that shows the number (frequency) of observations in each of several non-overlapping classes, typically referred to as bins. 1 Moderate CREATING DISTRIBUTIONS FROM DATA Multiple Choice False NATIONAL STANDARDS: United States - BUSPROG: Analytic United States - DISC: - Descriptive Statistics KEYWORDS: Bloom’s: Apply DATE CREATED: 1/23/2018 10:16 AM DATE MODIFIED: 3/19/2018 9:53 AM 51. What is the total relative frequency? 20XX Contest Sales Salesman FrequencyRelativeFrequency Frances Clonts 15 0.05 Sarah Leigh 184 0.62 Devon Pride 37 John Townes 62 0.21 POINTS: DIFFICULTY: REFERENCES: QUESTION TYPE: HAS VARIABLES: Copyright Cengage Learning. Powered by Cognero. Page 23
CH 02 - Descriptive Statistics Total a. 1 b. 99.12 c. 0.88 d. Not enough information ANSWER: RATIONALE: POINTS: DIFFICULTY: REFERENCES: QUESTION TYPE: HAS VARIABLES: NATIONAL STANDARDS: United States - BUSPROG: Analytic United States - DISC: - Descriptive Statistics KEYWORDS: Bloom’s: Apply DATE CREATED: 1/23/2018 10:16 AM DATE MODIFIED: 3/19/2018 9:53 AM 52. Below is a histogram for the number of days that it took Wyche Accounting to perform audits in the last quarter of last year. What is the bin size for the histogram? 298 a The relative frequencies always add to 1 1 Moderate CREATING DISTRIBUTIONS FROM DATA Multiple Choice False a. 3 b. 4 c. 16 Copyright Cengage Learning. Powered by Cognero. Page 24
CH 02 - Descriptive Statistics d. 5 ANSWER: RATIONALE: b (largest data value – smallest data value)/number of bins (32 – 13)/5 = 3.8, so we round up to 4 1 Moderate CREATING DISTRIBUTIONS FROM DATA Multiple Choice False NATIONAL STANDARDS: United States - BUSPROG: Analytic United States - DISC: - Descriptive Statistics KEYWORDS: Bloom’s: Apply DATE CREATED: 1/23/2018 10:16 AM DATE MODIFIED: 3/19/2018 9:53 AM 53. Select the histogram that is moderately skewed right. POINTS: DIFFICULTY: REFERENCES: QUESTION TYPE: HAS VARIABLES: ANSWER: RATIONALE: a. A b. B c. C d. D b A histogram is said to be skewed to the right if its tail extends farther to the right than to the left. Histogram B is moderately skewed to the right. Histogram D is highly skewed right. 1 Moderate CREATING DISTRIBUTIONS FROM DATA Multiple Choice False NATIONAL STANDARDS: United States - BUSPROG: Analytic United States - DISC: - Descriptive Statistics POINTS: DIFFICULTY: REFERENCES: QUESTION TYPE: HAS VARIABLES: Copyright Cengage Learning. Powered by Cognero. Page 25
CH 02 - Descriptive Statistics KEYWORDS: DATE CREATED: DATE MODIFIED: 54. Which graph represents a negative linear relationship between x and y? Bloom’s: Remember 1/23/2018 10:16 AM 3/19/2018 9:53 AM ANSWER: RATIONALE: a. A b. B c. C d. None of the graphs display a negative linear relationship. c A negative relationship means that if one variable gets bigger, the other variable tends to get smaller. POINTS: 1 DIFFICULTY: Moderate REFERENCES: MEASURES OF ASSOCIATION BETWEEN TWO VARIABLES QUESTION TYPE: Multiple Choice HAS VARIABLES: False NATIONAL STANDARDS: United States - BUSPROG: Analytic United States - DISC: - Descriptive Statistics KEYWORDS: Bloom’s: Apply DATE CREATED: 1/23/2018 10:16 AM DATE MODIFIED: 3/19/2018 9:53 AM 55. Below is the data for the number of days that it took Wyche Accounting to perform audits in the last quarter of last year. 56, 42, 37, 29, 45, 51, 30, 25, 34, 57 What is the median number of days that it took Wyche Accounting to perform audits in the last quarter of last year? a. 41 b. 40.6 c. 39.5 d. 42 ANSWER: c RATIONALE: The median is the value in the middle when the data are arranged in ascending order (smallest to largest value). The sorted data are 25, 29, 30, 34, 37, 42, 45, 51, 56, 57. In this case, the Copyright Cengage Learning. Powered by Cognero. Page 26
CH 02 - Descriptive Statistics median is the average of the two middle values = (37 + 42) / 2 = 39.5 1 Moderate MEASURES OF LOCATION Multiple Choice False NATIONAL STANDARDS: United States - BUSPROG: Analytic United States - DISC: - Descriptive Statistics KEYWORDS: Bloom’s: Apply DATE CREATED: 1/23/2018 10:16 AM DATE MODIFIED: 3/30/2018 9:51 AM 56. What is the mode of the data set given below? 35, 47, 65, 47, 22 a. 47.5 b. 47 c. 65 d. 22 ANSWER: b RATIONALE: Mode is a measure of location, defined as the value that occurs with greatest frequency. POINTS: 1 DIFFICULTY: Easy REFERENCES: MEASURES OF LOCATION QUESTION TYPE: Multiple Choice HAS VARIABLES: False NATIONAL STANDARDS: United States - BUSPROG: Analytic United States - DISC: - Descriptive Statistics KEYWORDS: Bloom’s: Apply DATE CREATED: 1/23/2018 10:16 AM DATE MODIFIED: 3/28/2018 2:48 PM 57. A sample of 13 adult males’ heights are listed below. 70, 72, 71, 70, 69, 73, 69, 68, 70, 71, 67, 71, 74 Find the range of the data. a. 7 b. 6.5 c. 5 d. 4 ANSWER: a RATIONALE: The simplest measure of variability is the range. The range can be found by subtracting the smallest value from the largest value in a data set. Range = 74 – 67 = 7. POINTS: DIFFICULTY: REFERENCES: QUESTION TYPE: HAS VARIABLES: Copyright Cengage Learning. Powered by Cognero. Page 27
CH 02 - Descriptive Statistics POINTS: DIFFICULTY: REFERENCES: QUESTION TYPE: HAS VARIABLES: NATIONAL STANDARDS: United States - BUSPROG: Analytic United States - DISC: - Descriptive Statistics KEYWORDS: Bloom’s: Remember DATE CREATED: 1/23/2018 10:16 AM DATE MODIFIED: 3/19/2018 9:53 AM 58. James’s manager asked him to sort the last names in the following list in descending order. What does this mean? Customer IDFirst Last Sales QuantityDiscount CG-12520 Claire Gute $ 261.96 2 DV-13045 Darrin VanHuff $ 14.62 2 SO-20335 Sean O'Donnell$ 957.58 5 BH-11710 Brosina Hoffman $ 48.86 7 AA-10480 Andrew Allen $ 25.55 3 IM- 15070 Irene Maddox $ 407.98 3 HP-14815 Harold Pawlan $ 68.81 5 PK-19075 Pete Kriz $ 665.88 6 AG-10270 AlejandroGrove $ 55.50 2 ZD-21925 ZuschussDonatelli$ 8.56 2 a. The last names must be sorted from A to Z. b. The last names must be sorted from Z to A. c. The last names must be sorted from the earliest to the latest that has been added to the list. d. James should use the Sort function to organize the data into order of sales. ANSWER: b RATIONALE: To sort in descending order is to sort from Z to A. POINTS: 1 DIFFICULTY: Moderate REFERENCES: MODIFYING DATA IN EXCEL QUESTION TYPE: Multiple Choice HAS VARIABLES: False NATIONAL STANDARDS: United States - BUSPROG: Analytic United States - DISC: - Descriptive Statistics KEYWORDS: Bloom’s: Apply DATE CREATED: 1/23/2018 10:16 AM DATE MODIFIED: 3/19/2018 9:53 AM 59. You have been asked to reorganize the Excel table below into order of sales using the Sales column. Which option will allow you to do this quickly? 1 Easy MEASURES OF VARIABILITY Multiple Choice False Profit $ 41.91 $ 16.87 $ (383.03) $ 14.17 $ 5.44 $ 132.59 $ (123.86) $ 13.32 $ 9.99 $ 2.48 0 0 0.45 0 0.2 0.2 0.8 0 0 0 Copyright Cengage Learning. Powered by Cognero. Page 28
CH 02 - Descriptive Statistics Customer IDFirst CG-12520 DV-13045 SO-20335 BH-11710 AA-10480 IM- 15070 HP-14815 PK-19075 AG-10270 ZD-21925 a. Use the Cut and Paste function to reorganize the data into order of sales. b. Use the Filter function to organize the data into order of sales. c. Use the Order function to organize the data into order of sales. d. Use the Sort function to organize the data into order of sales. ANSWER: d RATIONALE: The sort and filter tools in Excel allow you to organize and manipulate data quickly and easily. POINTS: 1 DIFFICULTY: Easy REFERENCES: MODIFYING DATA IN EXCEL QUESTION TYPE: Multiple Choice HAS VARIABLES: False NATIONAL STANDARDS: United States - BUSPROG: Analytic United States - DISC: - Descriptive Statistics KEYWORDS: Bloom’s: Apply DATE CREATED: 1/23/2018 10:16 AM DATE MODIFIED: 3/19/2018 9:53 AM 60. Which Excel command will return all modes when more than one mode exists? a. MODE.MULT b. MODE.SNGL c. MODE d. MODES ANSWER: a RATIONALE: Use the Excel command MODE.MULT to return more than one mode. POINTS: 1 DIFFICULTY: Moderate REFERENCES: MODIFYING DATA IN EXCEL QUESTION TYPE: Multiple Choice HAS VARIABLES: False NATIONAL STANDARDS: United States - BUSPROG: Analytic Last Gute VanHuff O'Donnell$ 957.58 Hoffman Allen Maddox Pawlan Kriz Sales $ 261.96 $ 14.62 QuantityDiscount 2 2 5 7 3 3 5 6 2 2 Profit $ 41.91 $ 16.87 $ (383.03) $ 14.17 $ 5.44 $ 132.59 $ (123.86) $ 13.32 $ 9.99 $ 2.48 Claire Darrin Sean Brosina Andrew Irene Harold Pete AlejandroGrove ZuschussDonatelli$ 8.56 0 0 0.45 0 0.2 0.2 0.8 0 0 0 $ 48.86 $ 25.55 $ 407.98 $ 68.81 $ 665.88 $ 55.50 Copyright Cengage Learning. Powered by Cognero. Page 29
CH 02 - Descriptive Statistics United States - DISC: - Descriptive Statistics Bloom’s: Remember 1/23/2018 10:16 AM 3/19/2018 9:53 AM KEYWORDS: DATE CREATED: DATE MODIFIED: 61. In a survey of patients in a local hospital, 62.42% of the respondents indicated that the health care providers needed to spend more time with each patient. Who makes up the population? a. All patients in a local hospital b. All survey respondents c. Hospital patients d. Cannot be determined from the information given ANSWER: a RATIONALE: A population is the set of all elements of interest in a particular study. POINTS: 1 DIFFICULTY: Easy REFERENCES: TYPES OF DATA QUESTION TYPE: Multiple Choice HAS VARIABLES: False NATIONAL STANDARDS: United States - BUSPROG: Analytic United States - DISC: - Descriptive Statistics KEYWORDS: Bloom’s: Apply DATE CREATED: 1/23/2018 10:16 AM DATE MODIFIED: 3/19/2018 9:53 AM 62. In a survey of patients in a local hospital, 62.42% of the respondents indicated that the health care providers needed to spend more time with each patient. Who makes up the sample? a. All patients in a local hospital b. All survey respondents c. Hospital patients d. Cannot be determined from the information given ANSWER: b RATIONALE: A sample is a subset of the population. POINTS: 1 DIFFICULTY: Easy REFERENCES: TYPES OF DATA QUESTION TYPE: Multiple Choice HAS VARIABLES: False NATIONAL STANDARDS: United States - BUSPROG: Analytic United States - DISC: - Descriptive Statistics KEYWORDS: Bloom’s: Apply DATE CREATED: 1/23/2018 10:16 AM DATE MODIFIED: 3/19/2018 9:53 AM 63. A manager of a fast food restaurant wants the drive-thru employee to ask every fifth customer if he or she is satisfied Copyright Cengage Learning. Powered by Cognero. Page 30
CH 02 - Descriptive Statistics with the service. Who makes up the population? a. All customers who use the drive-thru window of this fast food restaurant b. All survey respondents c. All customers of this restaurant d. The proportion of customers who say they are satisfied with their service ANSWER: a RATIONALE: A population is the set of all elements of interest in a particular study. POINTS: 1 DIFFICULTY: Easy REFERENCES: TYPES OF DATA QUESTION TYPE: Multiple Choice HAS VARIABLES: False NATIONAL STANDARDS: United States - BUSPROG: Analytic United States - DISC: - Descriptive Statistics KEYWORDS: Bloom’s: Apply DATE CREATED: 3/8/2018 10:31 AM DATE MODIFIED: 3/30/2018 9:42 AM 64. A manager of a fast food restaurant wants the drive-thru employee to ask every fifth customer if he or she is satisfied with the service. Who makes up the sample? a. All customers who use the drive-thru window of this fast food restaurant b. All survey respondents c. All customers of this restaurant d. The proportion of customers who say they are satisfied with their service ANSWER: b RATIONALE: A sample is a subset of the population. POINTS: 1 DIFFICULTY: Easy REFERENCES: TYPES OF DATA QUESTION TYPE: Multiple Choice HAS VARIABLES: False NATIONAL STANDARDS: United States - BUSPROG: Analytic United States - DISC: - Descriptive Statistics KEYWORDS: Bloom’s: Apply DATE CREATED: 3/8/2018 10:32 AM DATE MODIFIED: 3/30/2018 9:43 AM 65. Which of the following relationships would have a negative correlation coefficient? a. Supply and demand b. Amount of a bill at a restaurant and the amount of the tip c. Cost of a car and the amount of tax to be paid d. The square footage of a home and the price of the home ANSWER: a RATIONALE: A relationship will have a negative correlation coefficient if as one variable increases the other variable decreases. Copyright Cengage Learning. Powered by Cognero. Page 31
CH 02 - Descriptive Statistics POINTS: DIFFICULTY: REFERENCES: QUESTION TYPE: HAS VARIABLES: NATIONAL STANDARDS: United States - BUSPROG: Analytic United States - DISC: - Descriptive Statistics KEYWORDS: Bloom’s: Apply DATE CREATED: 3/8/2018 10:34 AM DATE MODIFIED: 3/19/2018 9:53 AM 66. The distribution of hourly sales for a local family owned store is normally distributed with a mean of $225 per hour and a standard deviation of $75 per hour. Which of the following intervals contains the middle 95% of hourly sales? a. $75 to $375 b. $150 to $300 c. $175 to $275 d. $125 to $325 ANSWER: a RATIONALE: In a normal curve, approximately 95% of observations fall within 2 standard deviations of the mean. POINTS: 1 DIFFICULTY: Moderate REFERENCES: ANALYZING DISTRIBUTIONS QUESTION TYPE: Multiple Choice HAS VARIABLES: False NATIONAL STANDARDS: United States - BUSPROG: Analytic United States - DISC: - Descriptive Statistics KEYWORDS: Bloom’s: Apply DATE CREATED: 3/8/2018 10:37 AM DATE MODIFIED: 3/19/2018 9:53 AM Subjective Short Answer 67. A student willing to participate in a debate competition is required to fill out a registration form. State whether each of the following information about the participant provides categorical or quantitative data. a. What is your birth month? b. Have you participated in any debate competition previously? c. If yes, in how many debate competitions have you participated so far? d. Have you won any of the competitions? e. If yes, how many have you won? ANSWER: a.Categorical b. Categorical c. Quantitative d. Categorical e. Quantitative POINTS: 1 DIFFICULTY: Easy 1 Easy MEASURES OF ASSOCIATION BETWEEN TWO VARIABLES Multiple Choice False Copyright Cengage Learning. Powered by Cognero. Page 32
CH 02 - Descriptive Statistics REFERENCES: QUESTION TYPE: HAS VARIABLES: NATIONAL STANDARDS: United States - BUSPROG: Analytic United States - DISC: - Descriptive Statistics KEYWORDS: Bloom’s: Apply DATE CREATED: 1/23/2018 10:16 AM DATE MODIFIED: 3/19/2018 9:53 AM 68. The following table provides information on the number of billionaires in a country and the continents on which these countries are located. Nationality Continent Number of Billionaires United States North America 426 Brazil South America 38 Russia Europe 105 Mexico North America 37 India Asia 54 Turkey Europe 40 United Kingdom Europe 31 Hong Kong Asia 39 Germany Europe 57 Canada North America 28 China Asia 120 a. Sort the countries from largest to smallest based on the number of billionaires. What are the top five countries according to the number of billionaires? b. Filter the countries to display only the countries located in North America. ANSWER: a. Nationality United States China Russia Germany India Turkey Hong Kong Brazil Mexico United KingdomEurope Canada The top five countries with the greatest number of billionaires are the United States, China, Russia, Germany, and India. b. Nationality United States Mexico Canada POINTS: 1 DIFFICULTY: Moderate TYPES OF DATA Subjective Short Answer False Continent North America Asia Europe Europe Asia Europe Asia South America North America Number of Billionaires 426 120 105 57 54 40 39 38 37 31 28 North America Continent North America North America North America Number of Billionaires 426 37 28 Copyright Cengage Learning. Powered by Cognero. Page 33
CH 02 - Descriptive Statistics REFERENCES: QUESTION TYPE: HAS VARIABLES: NATIONAL STANDARDS: United States - BUSPROG: Analytic United States - DISC: - Descriptive Statistics KEYWORDS: Bloom’s: Apply DATE CREATED: 1/23/2018 10:16 AM DATE MODIFIED: 4/27/2018 9:38 AM 69. The data on the percentage of visitors in the previous and current years at 12 well-known national parks of the United States are given below. Percentage of visitors previous year current year The Smokies 78.2% 84.2% The Grand Canyon 83.5% 81.6% Theodore Roosevelt 81.6% 84.8% Yosemite 74.2% 78.4% Yellowstone 77.9% 76.2% Olympic 86.4% 88.6% The Colorado Rockies 84.3% 85.4% Zion 76.7% 78.9% The Grand Tetons 84.6% 87.8% Cuyahoga Valley 85.1% 86.7% Acadia 79.2% 82.6% Shenandoah 72.9% 79.2% a. Sort the parks in descending order by their current year’s visitor percentage. Which park has the highest number of visitors in the current year? Which park has the lowest number of visitors in the current year? b. Calculate the change in visitor percentage from the previous to the current year for each park. Use Excel’s conditional formatting to highlight the parks whose visitor percentage decreased from the previous year to the current year. c. Use Excel’s conditional formatting tool to create data bars for the change in visitor percentage from the previous year to the current year for each park calculated in part b. ANSWER: a. The sorted list of parks for the current year appears as below: Percentage of visitors previous MODIFYING DATA IN EXCEL Subjective Short Answer False Percentage of visitors National Parks Percentage of visitors current year 88.6% 87.8% 86.7% 85.4% 84.8% 84.2% 82.6% 81.6% 79.2% 78.9% 78.4% 76.2% National Parks Olympic The Grand Tetons Cuyahoga Valley The Colorado Rockies Theodore Roosevelt The Smokies Acadia The Grand Canyon Shenandoah Zion Yosemite Yellowstone Olympic has the highest number of visitors in the current year, and Yellowstone has the lowest number of visitors in the current year. year 86.4% 84.6% 85.1% 84.3% 81.6% 78.2% 79.2% 83.5% 72.9% 76.7% 74.2% 77.9% Copyright Cengage Learning. Powered by Cognero. Page 34
CH 02 - Descriptive Statistics b. Percentage of visitors previous year 78.2% 83.5% 81.6% 74.2% 77.9% 86.4% 84.3% 76.7% 84.6% 85.1% 79.2% 72.9% Percentage of visitors current year 84.2% 81.6% 84.8% 78.4% 76.2% 88.6% 85.4% 78.9% 87.8% 86.7% 82.6% 79.2% Change in visitor percentage 6.00% -1.90% 3.20% 4.20% -1.70% 2.20% 1.10% 2.20% 3.20% 1.60% 3.40% 6.30% National Parks The Smokies The Grand Canyon Theodore Roosevelt Yosemite Yellowstone Olympic The Colorado Rockies Zion The Grand Tetons Cuyahoga Valley Acadia Shenandoah c. The output using Excel’s conditional formatting tool that created data bars for the change in visitor percentage from the previous year to the current year for each park appears as below. 1 Moderate MODIFYING DATA IN EXCEL Subjective Short Answer False POINTS: DIFFICULTY: REFERENCES: QUESTION TYPE: HAS VARIABLES: NATIONAL STANDARDS: United States - BUSPROG: Analytic United States - DISC: - Descriptive Statistics KEYWORDS: Bloom’s: Apply DATE CREATED: 1/23/2018 10:16 AM DATE MODIFIED: 3/19/2018 9:53 AM 70. The partial relative frequency distribution is given below: Group Relative Frequency 1 0.15 2 0.32 3 0.29 4 a. What is the relative frequency of group 4? Copyright Cengage Learning. Powered by Cognero. Page 35
CH 02 - Descriptive Statistics b. The total sample size is 400. What is the frequency of group 4? c. Show the frequency distribution. d. Show the percent frequency distribution. ANSWER: a. The relative frequency of group 4 is obtained as 1.00 – 0.15 – 0.32 – 0.29 = 0.24. b. If the total sample size is 400, the frequency of group 4 is obtained as 0.24 × 400 = 96. c. Group Relative Frequency 1 0.15 2 0.32 3 0.29 4 0.24 Total 1.00 d. Group Relative Frequency 1 0.15 2 0.32 3 0.29 4 0.24 Total 1.00 POINTS: 1 DIFFICULTY: Moderate REFERENCES: CREATING DISTRIBUTIONS FROM DATA QUESTION TYPE: Subjective Short Answer HAS VARIABLES: False NATIONAL STANDARDS: United States - BUSPROG: Analytic United States - DISC: - Descriptive Statistics KEYWORDS: Bloom’s: Apply DATE CREATED: 1/23/2018 10:16 AM DATE MODIFIED: 3/19/2018 9:53 AM 71. A survey on the most preferred newspaper in the USA listed The New York Times (TNYT), Washington Post (WP), Daily News (DN), New York Post (NYP), and Los Angeles Times (LAT) as the top five most preferred newspapers. The table below shows the preferences of 50 citizens. TNYTWP NYP WP TNYT DN TNYT LAT WP WP DN LAT TNYT TNYT NYP NYP TNYT WP LAT NYP LAT WP DN WP LAT WP DN TNYT DN DN TNYTTNYT LAT TNYT NYP LAT LAT NYP WP DN WP WP TNYT DN TNYT TNYTDN NYP TNYT WP a. Are these data categorical or quantitative? b. Provide frequency and percent frequency distributions. c. On the basis of the sample, which newspaper is preferred the most? ANSWER: a. The given data are categorical. Frequency 60 128 116 96 400 % Frequency 15 32 29 24 100 Copyright Cengage Learning. Powered by Cognero. Page 36
CH 02 - Descriptive Statistics b. Newspapers TNYT WP DN NYP LAT Total c. The most preferred newspaper is The New York Times. 1 Moderate CREATING DISTRIBUTIONS FROM DATA Subjective Short Answer False NATIONAL STANDARDS: United States - BUSPROG: Analytic United States - DISC: - Descriptive Statistics KEYWORDS: Bloom’s: Apply DATE CREATED: 1/23/2018 10:16 AM DATE MODIFIED: 3/28/2018 3:03 PM 72. The mentor of a class researched the number of hours spent on study in a week by each student of the class in order to analyze the correlation between the study hours and the marks obtained by each student. The data on the hours spent per week by 25 students are listed below. 13 14 16 15 12 12 19 21 22 19 13 16 18 25 21 17 18 23 16 12 24 20 14 22 15 a. What is the least amount of time a student spent per week on studying in this sample? The highest? b. Use a class width of 2 hours to prepare a frequency distribution, a relative frequency distribution, and a percent frequency distribution for the data. c. Prepare a histogram and comment on the shape of the distribution. ANSWER: a. The least time a student spent was 12 hours, and the highest was 25 hours. b. Hours in Study per WeekFrequencyRelative Frequency% Frequency 12–13 14–15 16–17 18–19 20–21 22–23 24–25 Total c. Frequency 14 12 9 7 8 50 % Frequency 28 24 18 14 16 100 POINTS: DIFFICULTY: REFERENCES: QUESTION TYPE: HAS VARIABLES: 5 4 4 4 3 3 2 25 0.2 0.16 0.16 0.16 0.12 0.12 0.08 1 20 16 16 16 12 12 8 100 Copyright Cengage Learning. Powered by Cognero. Page 37
CH 02 - Descriptive Statistics The distribution is skewed to the right. 1 Moderate CREATING DISTRIBUTIONS FROM DATA Subjective Short Answer False POINTS: DIFFICULTY: REFERENCES: QUESTION TYPE: HAS VARIABLES: NATIONAL STANDARDS: United States - BUSPROG: Analytic United States - DISC: - Descriptive Statistics KEYWORDS: Bloom’s: Apply DATE CREATED: 1/23/2018 10:16 AM DATE MODIFIED: 3/19/2018 9:53 AM 73. The manager of an automobile showroom studied the time spent by each salesperson interacting with the customer in a month apart from the other jobs assigned to them. The data in hours are given below. 17 13 18 16 20 24 15 19 19 12 10 16 26 27 13 23 17 15 24 20 14 21 26 24 Using classes 10-13, 14-17, and so on, show: a. The frequency distribution. b. The relative frequency distribution. c. The cumulative frequency distribution. d. The cumulative relative frequency distribution. e. The proportion of salesperson who spent 13 hours of time or less with the customers. f. Prepare a histogram and comment on the shape of the distribution. Copyright Cengage Learning. Powered by Cognero. Page 38
CH 02 - Descriptive Statistics ANSWER: a. – d. Relative Frequency 0.17 0.29 0.25 0.17 0.13 ˜1 Cumulative Frequency 4 11 17 21 24 Cumulative Relative Frequency 0.17 0.46 0.71 0.88 1.00 (approx.) Class 10–13 14–17 18–21 22–25 26–29 Total e. From the cumulative relative frequency distribution, 17% of the salespersons spent 13 hours of time or less with the customers. f. Frequency 4 7 6 4 3 24 The distribution is skewed to the right. 1 Challenging CREATING DISTRIBUTIONS FROM DATA Subjective Short Answer False POINTS: DIFFICULTY: REFERENCES: QUESTION TYPE: HAS VARIABLES: NATIONAL STANDARDS: United States - BUSPROG: Analytic United States - DISC: - Descriptive Statistics KEYWORDS: Bloom’s: Apply DATE CREATED: 1/23/2018 10:16 AM DATE MODIFIED: 3/19/2018 9:53 AM 74. The scores of a sample of students in a Math test are 20, 15, 19, 21, 22, 12, 17, 14, 24, 16 and in a Stat test are 16, 12, 19, 17, 22, 14, 20, 21, 24, 15, 13. a. Compute the mean and median scores for both the Math and the Stat tests. b. Compare the mean and median scores computed in part a. Comment. ANSWER: a. For Math test: Mean = 18 Median = 18 Copyright Cengage Learning. Powered by Cognero. Page 39
CH 02 - Descriptive Statistics For Stat test: Mean = 17.5 Median = 17 b. The mean and the median scores for statistics are lower than that for mathematics. These lower values are because of an additional score 13 for statistics, which is lower than the mean and the median scores for mathematics. 1 Moderate MEASURES OF LOCATION Subjective Short Answer False NATIONAL STANDARDS: United States - BUSPROG: Analytic United States - DISC: - Descriptive Statistics KEYWORDS: Bloom’s: Apply DATE CREATED: 1/23/2018 10:16 AM DATE MODIFIED: 3/19/2018 9:53 AM 75. Consider a sample on the waiting times (in minutes) at the billing counter in a grocery store to be 15, 24, 18, 15, 21, 20, 15, 22, 19, 16, 15, 22, 20, 15, and 21. Compute the mean, median, and mode. ANSWER: Mean = 18.53 Median = 19 Mode = 15 POINTS: 1 DIFFICULTY: Moderate REFERENCES: MEASURES OF LOCATION QUESTION TYPE: Subjective Short Answer HAS VARIABLES: False NATIONAL STANDARDS: United States - BUSPROG: Analytic United States - DISC: - Descriptive Statistics KEYWORDS: Bloom’s: Apply DATE CREATED: 1/23/2018 10:16 AM DATE MODIFIED: 3/19/2018 9:53 AM 76. Suppose that you make a fixed deposit of $1,000 in Bank X and $500 in Bank Y. The value of each investment at the end of each subsequent year is provided in the table. Year Bank X ($) Bank Y ($) 1 1,320 560 2 1,510 620 3 1,750 680 4 2,090 740 5 2,240 790 6 2,470 820 7 2,830 870 8 3,220 910 9 3,450 950 10 3,690 990 POINTS: DIFFICULTY: REFERENCES: QUESTION TYPE: HAS VARIABLES: Copyright Cengage Learning. Powered by Cognero. Page 40
CH 02 - Descriptive Statistics Which of the two banks provides a better return over this time period? ANSWER: a. Year 1 2 3 4 5 6 7 8 9 10 Bank X provides a better return when compared to Bank Y. POINTS: 1 DIFFICULTY: Challenging REFERENCES: MEASURES OF LOCATION QUESTION TYPE: Subjective Short Answer HAS VARIABLES: False NATIONAL STANDARDS: United States - BUSPROG: Analytic United States - DISC: - Descriptive Statistics KEYWORDS: Bloom’s: Apply DATE CREATED: 1/23/2018 10:16 AM DATE MODIFIED: 3/19/2018 9:53 AM 77. Consider a sample on the waiting times (in minutes) at the billing counter in a grocery store to be 15, 24, 18, 15, 21, 20, 15, 22, 19, 16, 15, 22, 20, 15, and 21. Compute the 25th, 50th, and 75th percentiles. ANSWER: 25th percentile = 15 50th percentile = 19 75th percentile = 21 POINTS: 1 DIFFICULTY: Moderate REFERENCES: ANALYZING DISTRIBUTIONS QUESTION TYPE: Subjective Short Answer HAS VARIABLES: False NATIONAL STANDARDS: United States - BUSPROG: Analytic United States - DISC: - Descriptive Statistics KEYWORDS: Bloom’s: Apply DATE CREATED: 1/23/2018 10:16 AM DATE MODIFIED: 3/19/2018 9:53 AM Bank X 1,000 1,320 1,510 1,750 2,090 2,240 2,470 2,830 3,220 3,450 3,690 Growth Factor 1.32 1.14 1.16 1.19 1.07 1.10 1.15 1.14 1.07 1.07 1.1395 13.95% Bank Y 500 560 620 680 740 790 820 870 910 950 990 Growth Factor 1.12 1.11 1.10 1.09 1.07 1.04 1.06 1.05 1.04 1.04 1.0707 7.07% Geometric Mean % of return Geometric Mean % of return Copyright Cengage Learning. Powered by Cognero. Page 41
CH 02 - Descriptive Statistics 78. Suppose that the average time an employee takes to reach the office is 35 minutes. To address the issue of late comers, the mode of transport chosen by the employee is tracked: private transport (two-wheelers and four-wheelers) and public transport. The data on the average time (in minutes) taken using both a private transportation system and a public transportation system for a sample of employees are given below. Private Transport Public Transport 27 30 33 29 28 25 32 20 20 27 34 32 30 37 28 38 18 21 29 35 a. What are the mean and median travel times for employees using a private transport? What are the mean and median travel times for employees using a public transport? b. What are the variance and standard deviation of travel times for employees using a private transport? What are the variance and standard deviation of travel times for employees using a public transport? c. Comment on the results. ANSWER: Travel times (in minutes) a. Using private transport: Mean = 27.9 Median = 28.5 Using public transport: Mean = 29.4 Median = 29.5 b. Using private transport: Variance= 27.43 Standard deviation = 5.24 Using public transport: Variance = 39.38 Standard deviation = 6.28 c. The travel times of employees using a private transport are less than those using a public transport. POINTS: 1 DIFFICULTY: Moderate REFERENCES: MEASURES OF LOCATION MEASURES OF VARIABILITY QUESTION TYPE: Subjective Short Answer HAS VARIABLES: False NATIONAL STANDARDS: United States - BUSPROG: Analytic United States - DISC: - Descriptive Statistics KEYWORDS: Bloom’s: Apply DATE CREATED: 1/23/2018 10:16 AM Copyright Cengage Learning. Powered by Cognero. Page 42
CH 02 - Descriptive Statistics DATE MODIFIED: 79. The average time a customer service executive takes to resolve an issue on a mobile handset is 26.4 minutes. The average times taken to resolve the issue by a sample of 15 such executives are shown below. Name Time (in minutes) Jack 25.3 Samantha 28.2 Richard 26.8 Steve 29.5 Mary 22.4 Sergio 21.7 John 24.3 Michelle 22.4 Linda 26.8 Mark 29.4 Matt 23.6 Polly 26.4 Sheila 23.5 Jeff 26.8 Gerald 28.1 a. What is the mean resolution time? b. What is the median resolution time? c. What is the mode for these 15 executives? d. What is the variance and standard deviation? e. What is the third quartile? ANSWER: a. Mean = 25.68 b. Median = 26.4 c. Mode = 26.8 d. Variance = 6.67; Standard deviation = 2.58 e. Third quartile = 28.1 POINTS: 1 DIFFICULTY: Moderate REFERENCES: ANALYZING DISTRIBUTIONS QUESTION TYPE: Subjective Short Answer HAS VARIABLES: False NATIONAL STANDARDS: United States - BUSPROG: Analytic United States - DISC: - Descriptive Statistics KEYWORDS: Bloom’s: Apply DATE CREATED: 1/23/2018 10:16 AM DATE MODIFIED: 3/19/2018 9:53 AM 80. Suppose that the average time an employee takes to reach the office is 35 minutes. To address the issue of late comers, the mode of transport chosen by the employee is tracked: private transport (two-wheelers and four-wheelers) and public transport. The data on the average time (in minutes) taken using both a private transportation system and a public transportation system for a sample of employees are given below. Private Transport Public Transport 27 30 4/27/2018 9:39 AM Copyright Cengage Learning. Powered by Cognero. Page 43
CH 02 - Descriptive Statistics 33 28 32 20 34 30 28 18 29 a. Considering the travel times (in minutes) of employees using private transport, compute the z-score for the tenth employee with travel time of 29 minutes. b. Considering the travel times (in minutes) of employees using public transport, compute the z-score for the second employee with travel time of 29 minutes. How does this z-score compare with the z-score you calculated for part a? c. Based on z-scores, do the data for employees using private transport and public transport contain any outliers? ANSWER: a. For tenth employee using private transport: First, calculate the mean (AVERAGE function in Excel) and standard deviation (STDEV.S function in Excel) for private transport. Mean = 27.9, StDev = 5.24 29 25 20 27 32 37 38 21 35 The z-score is then obtained as, b. For second employee using public transport: First, calculate the mean (AVERAGE function in Excel) and standard deviation (STDEV.S function in Excel) for public transport. Mean = 29.4, StDev = 6.28 The z-score is then obtained as, Even though the employees had the same travel time, the z-score for the tenth employee in the sample who used a private transport is much larger because that employee is part of a sample with a smaller mean and a smaller standard deviation. c. Travel Times using Private Transport 27 –0.17 33 0.97 28 0.02 32 0.78 20 –1.51 34 1.16 30 0.40 28 0.02 18 –1.89 29 0.21 No z-score is less than –3.0 or above +3.0; therefore, the z-scores do not indicate the existence of any outliers in either sample. 1 Challenging ANALYZING DISTRIBUTIONS Subjective Short Answer False Travel Times using Public Transport 30 29 25 20 27 32 37 38 21 35 z-score z-score 0.10 –0.06 –0.70 –1.50 –0.38 0.41 1.21 1.37 –1.34 0.89 POINTS: DIFFICULTY: REFERENCES: QUESTION TYPE: HAS VARIABLES: Copyright Cengage Learning. Powered by Cognero. Page 44
CH 02 - Descriptive Statistics NATIONAL STANDARDS: United States - BUSPROG: Analytic United States - DISC: - Descriptive Statistics KEYWORDS: Bloom’s: Apply DATE CREATED: 1/23/2018 10:16 AM DATE MODIFIED: 4/27/2018 9:39 AM 81. The results of a survey showed that, on average, children spend 5.6 hours on PlayStation per week. Suppose that the standard deviation is 1.7 hours and that the number of hours on PlayStation follows a bell-shaped distribution. a. Use the empirical rule to calculate the percentage of children who spend between 2.2 and 9 hours on PlayStation per week. b. What is the z-value for a child who spends 7.5 hours on PlayStation per week? c. What is the z-value for a child who spends 4.5 hours on PlayStation per week? ANSWER: a. According to the empirical rule, approximately 95% of data values will be within two standard deviations of the mean. 2.2 is two standard deviations less than the mean, and 9 is two standard deviations greater than the mean. Therefore, approximately 95% of children spend between 2.2 and 9 hours on PlayStation per week. b. c. 1 Moderate ANALYZING DISTRIBUTIONS Subjective Short Answer False POINTS: DIFFICULTY: REFERENCES: QUESTION TYPE: HAS VARIABLES: NATIONAL STANDARDS: United States - BUSPROG: Analytic United States - DISC: - Descriptive Statistics KEYWORDS: Bloom’s: Apply DATE CREATED: 1/23/2018 10:16 AM DATE MODIFIED: 3/28/2018 3:09 PM 82. A study on the average minutes spent by students on Internet usage is 300 with a standard deviation of 102. Answer the following questions assuming a bell-shaped distribution and using the empirical rule. a. What percentage of students use the Internet for more than 402 minutes? b. What percentage of students use the Internet for more than 504 minutes? c. What percentage of students use the Internet between 198 minutes and 300 minutes? ANSWER: a. 402 is one standard deviation above the mean. The empirical rule states that 68% of data values will be within one standard deviation of the mean. Because a bell-shaped distribution is symmetric, 0.5 × (1–68%) = 16% of the data values will be greater than (mean + 1 × standard deviation) 402. 16% of students use the Internet for more than 402 minutes. b. 504 is two standard deviations above the mean. The empirical rule states that 95% of data values will be within two standard deviations of the mean. Because a bell-shaped distribution is symmetric, 0.5 × (1– 95%) = 2.5% of the data values will be greater than (mean + 2 × standard deviation) 504. 2.5% of students use the Internet for more than 504 minutes. c. 198 is one standard deviation below the mean. The empirical rule states that 68% of data values will be within one standard deviation of the mean, and we expect that 0.5 × (1 – 68%) = 16% of data values will be below one standard deviation below the mean. 300 is the mean, Copyright Cengage Learning. Powered by Cognero. Page 45
CH 02 - Descriptive Statistics so we expect that 50% of the data values will be below the mean. Therefore, we expect 50% – 16% = 34% of the data values will be between the mean 300 and one standard deviation below the mean 198. 34% of students use the Internet between 198 minutes and 300 minutes. 1 Challenging ANALYZING DISTRIBUTIONS Subjective Short Answer False NATIONAL STANDARDS: United States - BUSPROG: Analytic United States - DISC: - Descriptive Statistics KEYWORDS: Bloom’s: Apply DATE CREATED: 1/23/2018 10:16 AM DATE MODIFIED: 3/28/2018 3:11 PM 83. Eight observations taken for two variables are as follows: POINTS: DIFFICULTY: REFERENCES: QUESTION TYPE: HAS VARIABLES: 11 13 17 18 22 24 26 28 35 32 26 25 20 17 11 10 a. Develop a scatter diagram with x on the horizontal axis. b. What does the scatter diagram developed in part (a) indicate about the relationship between the two variables? c. Compute and interpret the sample covariance. d. Compute and interpret the sample correlation coefficient. ANSWER: a. b. There appears to be a negative linear relationship between the x and y variables. c. Copyright Cengage Learning. Powered by Cognero. Page 46
CH 02 - Descriptive Statistics 11 13 17 18 22 24 26 28 35 32 26 25 20 17 11 10 –8.88 –6.88 –2.88 –1.88 2.13 4.13 6.13 8.13 13 10 4 3 -2 -5 -11 -12 –115.38 –68.75 –11.50 –5.63 –4.25 –20.63 –67.38 –97.50 –391 = = 19.88 22 . The negative covariance confirms that there is a negative linear relationship between the x and y variables in this data set. d. Then the correlation coefficient is calculated as: . The correlation coefficient again confirms and indicates a strong negative linear association between the x and y variables in this data set. 1 Challenging MEASURES OF ASSOCIATION BETWEEN TWO VARIABLES Subjective Short Answer False NATIONAL STANDARDS: United States - BUSPROG: Analytic United States - DISC: - Descriptive Statistics KEYWORDS: Bloom’s: Apply DATE CREATED: 1/23/2018 10:16 AM DATE MODIFIED: 4/27/2018 9:40 AM 84. Consider the following data on income and savings of a sample of residents in a locality: Income ($ thousands) Savings ($ thousands) 50 10 51 11 52 13 55 14 56 15 58 15 60 16 62 16 65 17 66 17 a. Compute the correlation coefficient. Is there a positive correlation between the income and savings? What is your POINTS: DIFFICULTY: REFERENCES: QUESTION TYPE: HAS VARIABLES: Copyright Cengage Learning. Powered by Cognero. Page 47
CH 02 - Descriptive Statistics interpretation? b. Show a scatter diagram of the relationship between the income and savings. ANSWER: a. 50 51 52 55 56 58 60 62 65 66 10 11 13 14 15 15 16 16 17 17 –7.5 –6.5 –5.5 –2.5 –1.5 0.5 2.5 4.5 7.5 8.5 –4.4 –3.4 –1.4 –0.4 0.6 0.6 1.6 1.6 2.6 2.6 56.25 42.25 30.25 6.25 2.25 0.25 6.25 20.25 56.25 72.25 292.5 19.36 11.56 1.96 0.16 0.36 0.36 2.56 2.56 6.76 6.76 52.4 33 22.1 7.7 1 –0.9 0.3 4 7.2 19.5 22.1 116 This indicates that there is a strong positive relationship between income and savings. b. 1 POINTS: Copyright Cengage Learning. Powered by Cognero. Page 48
CH 02 - Descriptive Statistics DIFFICULTY: REFERENCES: QUESTION TYPE: HAS VARIABLES: NATIONAL STANDARDS: United States - BUSPROG: Analytic United States - DISC: - Descriptive Statistics KEYWORDS: Bloom’s: Apply DATE CREATED: 1/23/2018 10:16 AM DATE MODIFIED: 4/27/2018 9:40 AM 85. Below is a histogram for the number of days that it took Wyche Accounting to perform audits in the last quarter of last year. What is the relative frequency of the 21-24 bin? Challenging MEASURES OF ASSOCIATION BETWEEN TWO VARIABLES Subjective Short Answer False 0.15 Relative frequency of a bin = Frequency of the bin/n. 3/20 = 0.15 1 Moderate CREATING DISTRIBUTIONS FROM DATA Subjective Short Answer False ANSWER: RATIONALE: POINTS: DIFFICULTY: REFERENCES: QUESTION TYPE: HAS VARIABLES: NATIONAL STANDARDS: United States - BUSPROG: Analytic United States - DISC: - Descriptive Statistics KEYWORDS: Bloom’s: Apply DATE CREATED: 1/23/2018 10:16 AM DATE MODIFIED: 3/19/2018 9:53 AM 86. Below is a histogram for the number of days that it took Wyche Accounting to perform audits in the last quarter of last year. What is the relative frequency of the 25-28 bin? Copyright Cengage Learning. Powered by Cognero. Page 49
CH 02 - Descriptive Statistics 0.10 Relative frequency of a bin = Frequency of the bin/n. So the relative frequency of the 25-28 bin = 2/20 = 0.10 1 Moderate CREATING DISTRIBUTIONS FROM DATA Subjective Short Answer False NATIONAL STANDARDS: United States - BUSPROG: Analytic United States - DISC: - Descriptive Statistics KEYWORDS: Bloom’s: Apply DATE CREATED: 1/23/2018 10:16 AM DATE MODIFIED: 3/19/2018 9:53 AM 87. Below are the data for the number of days that it took Wyche Accounting to perform audits in the last quarter of last year. 56, 42, 37, 29, 45, 51, 30, 25, 34, 57 What is(are) the mode(s) number of days that it took Wyche Accounting to perform audits in the last quarter of last year? ANSWER: None RATIONALE: Mode is a measure of location, defined as the value that occurs with greatest frequency. In this case, there are no values that occur more than once. POINTS: 1 DIFFICULTY: Moderate REFERENCES: MEASURES OF LOCATION QUESTION TYPE: Subjective Short Answer HAS VARIABLES: False NATIONAL STANDARDS: United States - BUSPROG: Analytic United States - DISC: - Descriptive Statistics ANSWER: RATIONALE: POINTS: DIFFICULTY: REFERENCES: QUESTION TYPE: HAS VARIABLES: Copyright Cengage Learning. Powered by Cognero. Page 50