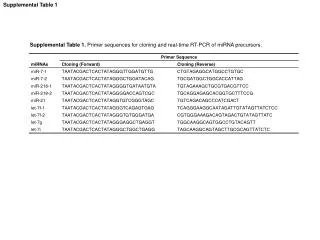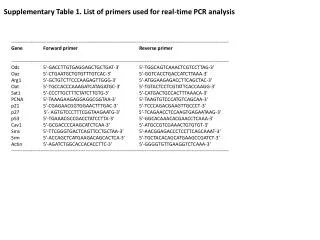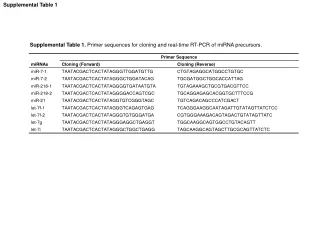
Supplementary Table 1 Sequences of the primer used for q-PCR analysis
70 likes | 260 Views
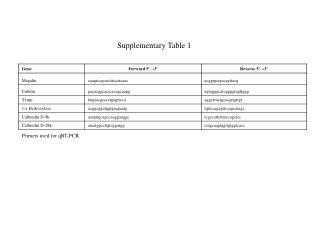
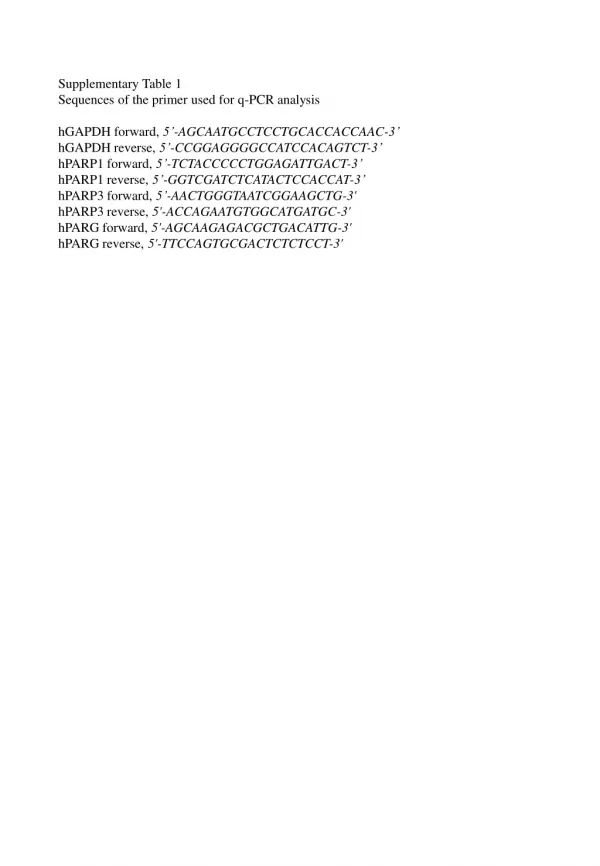
Supplementary Table 1 Sequences of the primer used for q-PCR analysis hGAPDH forward, 5’-AGCAATGCCTCCTGCACCACCAAC-3’ hGAPDH reverse, 5’-CCGGAGGGGCCATCCACAGTCT-3’ hPARP1 forward, 5’-TCTACCCCCTGGAGATTGACT-3’ hPARP1 reverse, 5’-GGTCGATCTCATACTCCACCAT-3’

Supplementary Table 1 Sequences of the primer used for q-PCR analysis
E N D
Presentation Transcript
Supplementary Table 1 Sequences of the primer used for q-PCR analysis hGAPDH forward, 5’-AGCAATGCCTCCTGCACCACCAAC-3’ hGAPDH reverse, 5’-CCGGAGGGGCCATCCACAGTCT-3’ hPARP1 forward, 5’-TCTACCCCCTGGAGATTGACT-3’ hPARP1 reverse, 5’-GGTCGATCTCATACTCCACCAT-3’ hPARP3 forward, 5’-AACTGGGTAATCGGAAGCTG-3' hPARP3 reverse, 5'-ACCAGAATGTGGCATGATGC-3' hPARG forward, 5'-AGCAAGAGACGCTGACATTG-3' hPARG reverse, 5'-TTCCAGTGCGACTCTCTCCT-3'
A p 1.0e-06 8.5 8.0 7.5 2log PARP1 n=83 7.0 n=318 6.5 6.0 Low risk High risk B C LowPARP1 (n=240) 1.0 1.0 MNSC 1.0 High PARP1 (n=82) LowPARP1 (n=300) 0.8 0.8 0.8 LowPARP1 (n=300) High PARP1 (n=101) 0.6 0.6 0.6 Overall survival Overall survival Event-free survival High PARP1 (n=101) 0.4 0.4 0.4 MNSC MNSC Low Risk 0.2 0.2 0.2 p 1.7e-03 p 9.4e-07 p 7.8e-06 0.0 0.0 0.0 48 96 48 96 48 96 144 192 144 192 144 192 Follow up in months Follow up in months Follow up in months D E 1.0 1.0 1.0 MNSC/High Risk MNSC/High Risk 0.8 0.8 LowPARP1 (n=240) 0.8 LowPARP1 (n=63) High PARP1 (n=82) 0.6 0.6 0.6 Event-free survival Overall survival Event-free survival 0.4 LowPARP1 (n=63) 0.4 0.4 High PARP1 (n=20) Low Risk 0.2 0.2 0.2 High PARP1 (n=20) p 1.1e-03 p 7.0e-04 p 1.6e-03 0.0 0.0 0.0 48 96 48 96 144 192 144 192 48 96 144 192 Follow up in months Follow up in months Follow up in months F G Figure S1 PARP1 expression predicts poor outcome in neuroblastoma patients. A, Box plot ofPARP1 expression relative to risk. B, C, D, E, F, G, Kaplan-Meier curves reporting patients overall and event-free survival probability with respect to PARP1 expression in the MNSC (B, C), low risk (D, E) and MNSC/high risk (F, G) patients subgroups. P value as indicated.
A B p 5.1e-12 n=183 p 1.5e-04 6.0 6.0 6.0 n=121 n=53 n=78 n=63 5.5 5.5 5.5 5.0 5.0 5.0 n=92 n=176 2log PARP2 2log PARP2 2log PARP2 n=401 4.5 n=322 4.5 4.5 4.0 4.0 4.0 3.5 3.5 3.5 MNA MNSC Stage 4 Stage 1 Stage 2 Stage 3 Stage 4S Low Risk High Risk C D 1.0 1.0 6.5 p 3.3e-08 6.0 0.8 0.8 LowPARP2 (n=372) 5.5 LowPARP2 (n=372) 0.6 0.6 Event-free survival 5.0 Overall survival High PARP2 (n=126) 2log PARP2 High PARP2 (n=126) n=83 0.4 0.4 n=318 4.5 0.2 0.2 4.0 p 5.9e-03 p 1.0e-03 0.0 3.5 0.0 48 96 48 96 144 192 144 192 Follow up in months Follow up in months Low Risk High Risk MNSC E F Figure S2 PARP2 expression, like PARP1, predicts poor prognosis and is associated with stage, MYCN status and risk in NB patients. A, B, C, D,Box plot of PARP2 expression relative to tumor stage (A), MYCN status (B), and risk classification in the total set (C) or in the MNSC subgroup (D). P values: 5.2e-03 (stage 2 versus stage 4) and 0.02 (stage 4 versus stage 4S). E, F, Overall (E) and event-free (F) survival relative to PARP2 expression in NB patients. P value as indicated.
B C A * 0.08 0.06 MYCN- MYCN+ Relative PARP2 mRNA expression 0.04 * 0.02 0.00 MNSC MNA D 2.5 0.2 2.0 Color key: *** 1.5 Relative mRNA expression 0.1 mRNA expression (fold change) Low High expression 1.0 0.0 PARP1 0.5 MYCN 0 b-Actin PARG PARP3 SK-N-SH SK-N-MYC Figure S3 PARP isoforms expression in neuroblastoma. A, Heat map diagram of PARP isoforms and PAR degrading enzymes (PARG, TARG1 and ARH3) expression in primary neuroblastoma samples (GSE62564 R2-dataset). Samples are clustered by MYCN status (MNSC, MYCN single copy and MNA, MYCN amplified). Expression levels are indicated by color intensity as shown in the color key legend. P values are reported. B, Real Time q-PCR of PARP2 expression in the MNSC and MNA cell lines reported in Fig. 1. C, Real Time q-PCR and WB analysis of PARP1 expression in the stably transfected SK-N-MYC compared with the control. For qPCRs, the levels of PARP1 and PARP2 mRNA were normalized on GAPDH expression. Data are reported as averages (+/- SD) of two independent experiments (*P<0.05). D, Real time q-PCR of PARG and PARP3 expression in the MYCN+/- SHEP Tet21/N system confirms R2-based expectations. The levels of mRNA were normalized on GAPDH expression. Data are reported as averages (+/- SD) of three (for PARG) and two (for PARP3) independent experiments (* P<0.05; ***P<0.005).
SK-N-SH MYCN+ MYCN- Kelly A B Ola - + - + - + - + MYCN- MYCN+ ** PAR ** ** Colony number (%) ** Hsp70 CTR 5 mM 10 mM CTR 5 mM 10 mM 120 SK-N-SH 1.2 Kelly 100 1.0 80 D 0.8 C Colony number (%) 60 0.6 40 0.4 20 0.2 0 0 MYCN- CTR MYCN- Ola MYCN+ CTR MYCN+ Ola Cell number (*10^4) 0 48 72 96 Time (hours) Figure S4 MNA and MYCN-OE cells are more sensitive to PARP inhibitors. A, WB analysis of PARylation in olaparib treated MNSC, MNA and MYCN-overexpressing cells. Blots were probed with anti-PAR antibody and Hsp70 was used as loading control. B, C Colony formation assay performed on SK-N-SH, Kelly (B) and MYCN+/- (C) neuroblastoma cells after exposure to olaparib or DMSO (CTR) for 24 hours. Data are reported as averages (+/- SD; **P<0.01). D, Viable cell counts performed on MYCN+/- cells treated with or without olaparib for the indicated times. Data are reported as averages (+/- SD) of three independent experiments.
A B MYCN+/CTR MYCN-/CTR MYCN+/Ola *** MYCN-/Ola C D Tail moment (fold ind.) EdU + cells (%) SK-N-SH CTR SK-N-SH Ola Kelly CTR Kelly Ola 3h 9h 24h 6h 12h EdU - + - + - + - + Ola 9 12 Kelly SK-N-SH SK-N-SH SK-N-SH SK-N-SH SK-N-SH 24 Kelly SK-N-SH SK-N-SH Kelly Kelly Kelly Kelly Kelly + - + - + - + - + - + - + - + - + - + - Ola 15 h 24 h Chk1S345P # cells Chk1 Cdc25a p53S15P p53 7-AAD E b-actin Figure S5 Olaparib effects on neuroblastoma cells. A, Flow cytometry analysis of DNA synthesis (EdU) and DNA content (7-AAD) in indicated cells treated with or without olaparib for 48 hours. Cell cycle profiles are reported in lower panels. The arrowhead indicates the EdU-negative nuclei featuring <4N DNA content. B, Representative images of nuclear morphology in Hoechst 33258 stained MYCN+/- cells treated with or without olaparib for 48 hours. (Scale bar: 10μm). C, Neutral comet assay performed in the indicated cells treated with or without olaparib for 15 and 24 hours. Data are reported as averages (+/- SE) of three independent experiments (*** P<0.001). D, WB analysis of whole cell lysates prepared from the indicated cells. Blots were probed with the indicated antibodies. E, Percentage of EdU positive cells in MYCN+/- treated with or without olaparib at indicated times.
A B C 1 10 0 0.01 0.1 Ola [mM] 0 1 10 Ola [mM] PAR CHKSer345P CHK1 Cell cycle distribution (%) b-actin b-actin Ola [mM] 0 1 10 D Vel [mM] Tal [mM] 1 10 0 0.01 0.1 0.5 2 0.01 0.1 PAR b-actin Figure S6 PARP enzymatic inhibition is not sufficient to induce cell cycle dysregulation. A, WB analysis of PARylation in MYCN-overexpressing cells after 9 hours of olaparib treatment at the indicated concentrations. Blots were probed with anti-PAR antibody and b-actin was used as loading control. MYCN-overexpressing cells treated for 9 hours with or without olaparib at the indicated concentrations were analyzed by flow cytometry for DNA content (B) and by WB for CHK1 phosphorylation (C). D, WB analysis of PARylation in MYCN-overexpressing cells after 48 hours of veliparib (Vel) and talazoparib (Tal) treatment at indicated concentrations. Blots were probed with anti-PAR antibody and anti b-actin as loading control.