Download
1 / 21
210 likes | 355 Views
Parallel R ( pR ). For High Performance Statistical Computing. Nagiza F. Samatova (ORNL) Srikanth Yoginath (ORNL) Guruprasad Kora (ORNL) David Bauer (GT) Chongle Pan (UTK/ORNL). SDM AHM @ Salt Lake City March 3-4, 2005. Contact : Nagiza Samatova, samatovan@ornl.gov. Outline.

E N D
Parallel R (pR) For High Performance Statistical Computing • Nagiza F. Samatova (ORNL) • Srikanth Yoginath (ORNL) • Guruprasad Kora (ORNL) • David Bauer (GT) • Chongle Pan (UTK/ORNL) SDM AHM @ Salt Lake City March 3-4, 2005 Contact: Nagiza Samatova, samatovan@ornl.gov
Outline • About Parallel R • Motivation • About R and its parallelization efforts • Task and data parallelism with Parallel R (pR) • Extensibility of Parallel R • Performance Benchmarks • Parallel R across Different Applications • GIS data analysis with GRASS and Parallel R • Clustered Climate Regimes using Parallel R • Fusion scenario challenges Parallel R • Quantitative Proteomics in Biology using Parallel R • Summary and Future Work
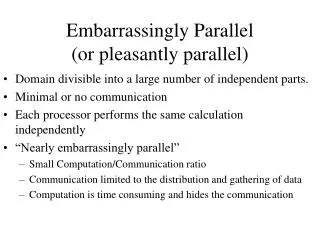
Tera-(Flop & Byte) Analyses Could Be Routine for Scientific Applications But… Hits 1Tflop/sec Algorithmic Complexity: Calculate meansO(n) Calculate FFTO(n log(n)) Calculate PCAO(r• c) Hierarchical clust. O(n2) • Climate • Now: 20-40TB per simulated year • 5 yrs: 100TB/yr 5-10PB/yr • Astrophysics • Now and 5 yrs: Can soak up anything! • Fusion • Now: 100Mbytes/15min • 5 yrs: 1000Mbytes/2 min
> library(mva) > pca <- prcomp(data) > summary(pca) > … > dyn.load( “foo.so”) > .C( “foobar” ) > dyn.unload( “foo.so” ) snow API Statistical Computing with R • About R (http://www.r-project.org/): • R is an Open Source (GPL), most widely used programming environment for statistical analysis and graphics; similar to S. • Provides good support for both users and developers. • Highly extensible via dynamically loadable add-on packages. • Originally developed by Robert Gentleman and Ross Ihaka. > library (rpvm) > .PVM.start.pvmd () > .PVM.addhosts (...) > .PVM.config () Towards Enabling Parallel Computing in R: • Rmpi(Hao Yu): R interface to LAM-MPI. • rpvm (Na Li and Tony Rossini): R interface to PVM; requires knowledge of parallel programming. • snow (Luke Tierney): general API on top of message passing routines to provide high-level (parallel apply) commands; mostly demonstrated for embarrassingly parallel applications .
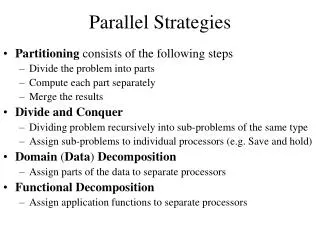
Motivation behind Parallel R (pR) • Ideal Programming Requirements: • Be able to use existing high level (i.e. R) code • Require minimal extra efforts for parallelizing • Have Identical/similar (presumably easy-to-use) interface to R’s • Be able to test codes in sequential settings • Provide efficient and scalable (in terms of problem size and number of processors) performance
Task-parallel analyses: Data-parallel analyses: Task Parallelism Data Parallelism D a t a D a t a • Likelihood Maximization. • Re-sampling schemes: Bootstrap, Jackknife, etc. • Animations • Markov Chain Monte Carlo (MCMC). • Multiple chains. • Simulated Tempering: running parallel chains at different “temperature“ to improve mixing. • k-means clustering • Principal Component Analysis (PCA) • Hierarchical (model-based) clustering • Distance matrix, histogram, etc. computations RScaLAPACK Task-pR Task & Data Parallelism withpR ::::::: fileList<-list.files(pattern="*.nc"); PE ( for (i in 1:length(fileList)) { matrix [i] readNcFile (fileList[i]); pca [i] sla.prcomp (matrix [i]) } ) ::::::::::::: ::::::: fileList<-list.files(pattern="*.nc"); for (i in 1:length(fileList)) { matrix [i] readNcFile (fileList[i]); pca [i] prcomp (matrix [i]) } ::::::::::::: pR R Providing Task and Data Parallelism in pR
Third Party Parallel Codes R Environment Parallel Agent RScaLAPACK ScaLAPACK pMatrix Matrix Robject pAlok Parallel k-means Alok’s Data Mining C/Fortran MPI • Define R function parameters & returns • Map R functions to defined function interfaces • Define the function interfaces • Set parallel environment limits for your functions • Define data distribution function (Optional) • Convert your MPI/PVM routine(s) into a set of functions. • Create a shared library of your functions. • Place it in a predefined location. Extensibility of Parallel R (pR)
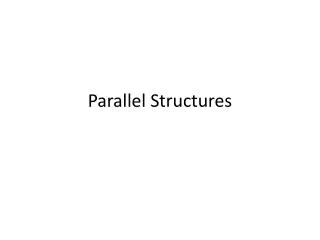
Speedup for Parallel R’s sla.solve() over serial R’s solve(). Matrix size: Architecture: SGI Altix at CCS of ORNL with 256Intel Itanium2 processors at 1.5 GHz; 8 GB of memory per processor (2 TB system memory); 64-bit Linux OS; 1.5 TeraFLOPs/s theoretical total peak performance. Scalability of Parallel R (pR) R> solve (A,B) pR> sla.solve (A, B, NPROWS, NPCOLS, MB) A and Bare the input matrices; NPROWS and NPCOLS are process grid specs; MB is block size
Matrix size: Overhead due to R & Parallel Agent in pR
Parallel R (pR) Distribution http://www.ASPECT-SDM.org/Parallel-R • Releases History: • pR enables both data and task parallelism (includes task-pR and RScaLAPACK) (2004/Q4) • RScaLAPACK provides R interface to ScaLAPACK with its scalability in terms of problem size and number of processors using data parallelism (2004/Q2) • task-pR achieves parallelism by performing out-of-order execution of tasks. With its intelligent scheduling mechanism it attains significant gain in execution times (2004/Q3) • pMatrix provides a parallel platform to perform major matrix operations in parallel using ScaLAPACK and PBLAS Level II & III routines (2005/Q2) • Also: Available for download from R’s CRAN web site (www.R-Project.org) with 37 mirror sites in 20 countries
$> grass5 <dataset> $> pR GRASS > library (GRASS) > G gmeta() > … pR GRASS Geo-statistical and Spatial Data Analysis with GRASS and Parallel R With: George Fann, John Drake, and Bhaduri Budhendra • About GRASS (http://grass.itc.it/): • GRASS (Geographic Resources Analysis Support System) is a raster/vector GIS, image processing system, and graphics production. • GRASS contains over 350 programs and tools to render maps and images on monitor and paper; manipulate raster, vector, and sites data; process multi spectral image data; create, manage, and store spatial data. • It is Free (Libre) Software/Open Source released under GNU GPL. • Parallel R (pR) extension for GRASS: • Leverages the work by Markus Neteler (http://grass.itc.it/statsgrass/grass_geostats.html). • Offers a richer set of statistical analysis capabilities including (Basic Statistics, Exploratory Data Analysis, Linear Models, Multivariate Analysis, Time Series Analysis, etc.) • Provides high performance and parallel computational platform for large datasets
$> grass5 $> pR …. > topo.meter.ls6 surf.ls (6, topo.meter) > topo.meter.surface6 trmat (topo.meter.ls6, 0, 100, 0, 100, 50) > image (topo.meter.surface6) > contour (topo.meter.surface6, labcex = 0.8, add=T) > points (topo.meter$x, topo.meter$y) $> grass5 $> pR …. > library (MASS) > data (volcano) > plot (density (volcano, bw=2)) > lines (density (volcano, bw=4), col="green") > lines (density (volcano, bw=8), col="red") > lines (density (volcano, bw=12), col="cyan") Trend Surface Fitting Kernel Density Estimation Kernel Density Estimation Trend Surface Fitting Principal Component Analysis Grass/Parallel-R Examples
Geographic Space Variables (V) Variable Space B06.12.nc B05.12.nc Read nc files Normalize µ=0 & σ=1 Cluster k-means 16.6M x 3 Spatio-Temporal Pts 5-yr BAU PCM 2000-2098 runs 2.8°×2.8°; 18 levels • 2,796 out of 8,192 total land grid cells • V: Temperature, Precipitation, Soil Moisture • Pts: (latitude, longitude, level, time) Statistics Geographic Space B09.12.nc k=32, time Re-assemble; Stat. Analyses Temperature No. of Pts Precipitations Soil Moisture Cluster Number Clustered Climate Regimes AnalysisWith: W. Hargrove, F. Hoffman, and D. Erickson
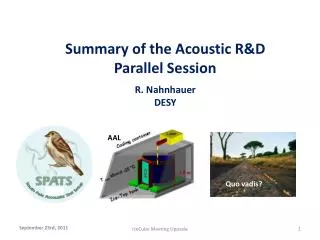
16.6 million points; ~20 iterations Scalability of pk-means() in pR
A toroidal slice of the electrostatic field of a tokamak fusion simulation (polar coord. as Cartesian) Fusion Scenario Challenges Parallel RWith: George Ostrouchov and Don Batchelor Mahalanobis Distance easy 250,000 points 10% sampling for ~1hr analysis Hierarchical Model-based Clustering (mclust) hard Expectation Maximization (EM) easy
Experimental Step Liquid Chromatography- Mass Spectrometry (LC-MS) 24 hours measurements Sample of ~2,000 labeled proteins (N15) in different ratios ~3GB raw data + ~50,000 MS, MS/MS files ~1KByte each Quantification Step Sequence Id Step Ratio Calculations DBDigger+SEQUEST ~15-18 hours RelEx RelEx ~50,000 Chromatogram Files; ~1KB each Quantitative Proteomics in BiologyWith: Bob Hettich, Hays McDonald, and Greg Hurst
1. Read chromatogram file [CHROMATOGRAMS] SCAN TIME SAMPLE REFERENCE 1537 32.8275 4727570 4509290 1541 32.8978 1120668 4377465 1545 32.9718 4298401 4713328 1549 33.0477 2975233 9286918 ….. …….. ……….. Ratio Calculations for ~50,000 files 3. Calculate Ratio=Slope(Eigenvector) 2. Select Peak Window • Subtract background noise from data • Generate Covariance Chromatogram (red) • Apply Savitzky-Golay Smoother (blue) • Calculate cut-off for search (cyan) • Find Window with Max. SN ratio (green)
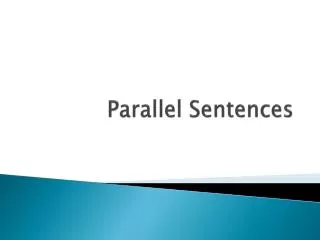
log (Signal/Noise) = log (λ1/λ2)2 Relative Frequency log (Ratio) log(Ratio) = log (Slope (Eigenvector1)) Ratio Estimation over ~50,000 files
Parallel Version Serial Version ::::::: chroList<-list.files(pattern="*.chro"); cat ("Chro", "samSN", "refSN", "PPCSN", "HR", "PCA", "PCASN", file="Pratio-Peptide.txt"); PE ( for (i in 1:length(chroList)) { currResult [i] Pratio(filename=chroList[i]); } ) for (i in 1:length(chroList)) { cat (chroList[i], currResult$samSN, currResult$refSN, currResult$PPCSN, currResult$HR, currResult$PCA, currResult$PCASN, file="Pratio-Peptide.txt"); } ::::::::::::: ::::::: chroList<-list.files(pattern="*.chro"); cat ("Chro", "samSN", "refSN", "PPCSN", "HR", "PCA", "PCASN", file="Pratio-Peptide.txt"); for (i in 1:length(chroList)) { currResult [i] Rratio(filename=chroList[i]); } for (i in 1:length(chroList)) { cat (chroList[i], currResult$samSN, currResult$refSN, currResult$PPCSN, currResult$HR, currResult$PCA, currResult$PCASN, file="Pratio-Peptide.txt"); } ::::::::::::: Ratio Calculations with Parallel R
Summary and Future Work • Parallel R (pR) is an Open Source high performance library for statistical computing in R • It has been deployed in a number of applications including: climate, GIS, fusion, and biology • Future improvements in few major directions: • Demonstrate more application scenarios • Add more libraries like RScaLAPACK, PMatrix (e.g. pAlok, pclust, pnetCDF) • Improve the performance (reduce overhead, memory management) of Parallel Agent • Enhance features of Parallel Agent: • Support outside of Master-Slave model • Better memory management strategies (one-sided put(), get(), release(), etc.) • Support of parallel I/O over netCDF and HDF files