Download
1 / 69
710 likes | 893 Views
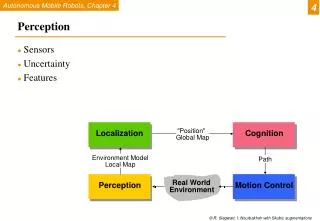
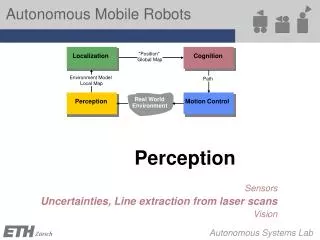
"Position". Localization. Cognition. Global Map. Environment Model. Path. Local Map. Real World. Perception. Motion Control. Environment. Perception. Sensors Uncertainties, Line extraction from laser scans Vision. Perception – Uncertainty, Fusion. 4a - Sensors case studies

E N D
"Position" Localization Cognition Global Map Environment Model Path Local Map RealWorld Perception Motion Control Environment Perception Sensors Uncertainties, Line extraction from laser scans Vision
4b - Perception - Uncertainty Perception – Uncertainty, Fusion • 4a - Sensors • case studies • classification, performance • technology overview • 4b – Uncertainties, Line extraction from laser scans • 4c - Vision
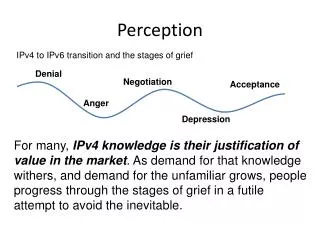
4b - Perception - Uncertainty Uncertainty Representation • Sensing is always related to uncertainties. • How can uncertainty be represented or quantified? • How do they propagate - uncertainty of a function of uncertain values? • How do uncertainties combine if different sensor reading are fused? • What is the merit of all this for mobile robotics?
4b - Perception - Uncertainty Uncertainty Representation (2)
4b - Perception - Uncertainty Gaussian Distribution 0.4 68.26% 95.44% 99.72% -2 -1 1 2
4b - Perception - Uncertainty The Error Propagation Law: Motivation • Imagine extracting a line based on point measurements with uncertainties. • The model parameters ri (length of the perpendicular) and qi (its angle to the abscissa) describe a line uniquely. • The question: • What is the uncertainty of the extracted line knowing the uncertainties of the measurement points that contribute to it ?
X Y 1 1 … … X Y System i i … … X Y n m 4b - Perception - Uncertainty The Error Propagation Law Error propagation in a multiple-input multi-output system with n inputs and m outputs.
4c - Perception - Uncertainty The Error Propagation Law • One-dimensional case of a nonlinear error propagation problem • It can be shown that the output covariancematrix CY is given by the error propagation law: • where • CX: covariance matrix representing the input uncertainties • CY: covariance matrix representing the propagated uncertainties for the outputs. • FX: is the Jacobian matrix defined as: • which is the transposed of the gradient of f(X).
4b - Perception - Uncertainty Example: line extraction from laser scans
4b - Perception - Uncertainty Features Based on Range Data: Line Extraction (1) • Point-Line distance • Least Square • Least Square
4b - Perception - Uncertainty Features Based on Range Data: Line Extraction (1) • Point-Line distance • Weighted Least Square • Least Square
4b - Perception - Uncertainty Features Based on Range Data: Line Extraction (2) • 17 measurement • error s2 proportional to r2 • weighted least square:
4b - Perception - Uncertainty Propagation of uncertainty during line extraction = ? (output covariance matrix that we want to determine) Jacobian:
4b - Perception - Features Environment Map • Features for Localization • Compact map 26 bytes / m2 • Multi-hypothesis tracking • Topological map for global planning • Raw data for local planning and obstacle avoidance
4b - Perception - Features 11 RoboX @ expo.02 56 s
4d - Perception - Features Application to Simultaneous Localization and Mapping (Chapter 5) • corner features extracted from lines • connecting corners to structures
photograph of corridor at ASL raw 3D scan extracted planes for every cube plane segmentation result 4d - Perception - Features Example Result
4b - Perception - Features Features: Motivation • Why Features: • Raw data: huge amount of data to be stored • Compact features require less storage (e.g. Lines, planes) • Provides rich and accurate information • Basis for high level features (e.g. more abstract features, objects)
Line Extraction Split and merge Linear regression RANSAC Hough-Transform
4b - Perception - Features Line Extraction: Motivation • Map of the ASL hallway built using line segments
4b - Perception - Features Line Extraction: Motivation • Map of the ASL hallway built using orthogonal planes constructed from line segments
4b - Perception - Features Line Extraction: Motivation • Why laser scanner: • Dense and accurate range measurements • High sampling rate, high angular resolution • Good range distance and resolution. • Why line segment: • The simplest geometric primitive • Compact, requires less storage • Provides rich and accurate information • Represents most office-like environment.
r α 4b - Perception - Features Line Extraction: The Problem • Scan point in polar form: (ρi, θi) • Assumptions: • Gaussian noise with (0, σ) for ρ • Negligible angular uncertainty • Line model in polar form: • x cos α + y sin α = r • -π < α <= π • r >= 0
4b - Perception - Features Line Extraction: The Problem (2) • Three main problems: • How many lines ? • Which points belong to which line ? • This problem is called SEGMENTATION • Given points that belong to a line, how to estimate the line parameters ? • This problem is called LINE FITTING • The Algorithms we will see: • Split and merge • Linear regression • RANSAC • Hough-Transform
4b - Perception - Features Algorithm 1: Split-and-Merge (standard) • The most popular algorithm which is originated from computer vision. • A recursive procedure of fitting and splitting. • A slightly different version, called Iterative-End-Point-Fit, simply connects the end points for line fitting.
4b - Perception - Features Algorithm 1: Split-and-Merge (Iterative-End-Point-Fit)
4b - Perception - Features Algorithm 1: Split-and-Merge
4b - Perception - Features Algorithm 1: Split-and-Merge: Example application
4d - Perception - Features Algorithm 2: Line-Regression • Uses a “sliding window” of size Nf • The points within each “sliding window” are fitted by a segment • Then adjacent segments are merged if their line parameters are close Nf = 3
4d - Perception - Features Algorithm 2: Line-Regression
4d - Perception - Features Algorithm 3: RANSAC • Acronym of Random Sample Consensus. • It is a generic and robust fitting algorithm of models in the presence of outliers (points which do not satisfy a model) • RANSAC is not restricted to line extraction from laser data but it can be generally applied to any problem where the goal is to identify the inliers which satisfy a predefined mathematical model. • Typical applications in robotics are: line extraction from 2D range data (sonar or laser); plane extraction from 3D range data, and structure from motion • RANSAC is an iterative method and is non-deterministic in that the probability to find a line free of outliers increases as more iterations are used • Drawback: A nondeterministic method, results are different between runs.
Algorithm 3: RANSAC • Select sample of 2 points at random
Algorithm 3: RANSAC • Select sample of 2 points at random • Calculate model parameters that fit the data in the sample
RANSAC • Select sample of 2 points at random • Calculate model parameters that fit the data in the sample • Calculate error function for each data point
Algorithm 3: RANSAC • Select sample of 2 points at random • Calculate model parameters that fit the data in the sample • Calculate error function for each data point • Select data that support current hypothesis
Algorithm 3: RANSAC • Select sample of 2 points at random • Calculate model parameters that fit the data in the sample • Calculate error function for each data point • Select data that support current hypothesis • Repeat sampling
Algorithm 3: RANSAC • Select sample of 2 points at random • Calculate model parameters that fit the data in the sample • Calculate error function for each data point • Select data that support current hypothesis • Repeat sampling
Algorithm 3: RANSAC ALL-INLIER SAMPLE
4b - Perception - Uncertainty Algorithm 3: RANSAC
4b - Perception - Uncertainty Algorithm 3: RANSAC • How many iterations does RANSAC need? • Because we cannot know in advance if the observed set contains the maximum number of inliers, the ideal would be to check all possible combinations of 2 points in a dataset of N points. • The number of combinations is given by N(N-1)/2, which makes it computationally unfeasible if N is too large. For example, in a laser scan of 360 points we would need to check all 360*359/2= 64,620 possibilities! • Do we really need to check all possibilities or can we stop RANSAC after iterations? The answer is that indeed we do not need to check all combinations but just a subset of them if we have a rough estimate of the percentage of inliers in ourdataset • This can be done in a probabilistic way
4b - Perception - Uncertainty Algorithm 3: RANSAC • How many iterations does RANSAC need? • Let w be the fraction of inliers in the data. w = number of inliers / Nwhere N is the total number of points. w represents also the probability of selecting an inlier • Let p be the probability of finding a set of points free of outliers • If we assume that the two points needed for estimating a line are selected independently, w2 is the probability that both points are inliers and 1-w2 is the probability that at least one of these two points is an outlier • Now, letkbe the number of RANSAC iterations executed so far, then (1-w2) k will be the probability that RANSAC never selects two points that are both inliers. This probability must be equalto (1-p). Accordingly,1-p = (1-w2) k and therefore
4b - Perception - Uncertainty Algorithm 3: RANSAC • How many iterations does RANSAC need? • The number of iterations k is • This expression tells us that knowing the fraction of inliers w, after k RANSAC iterations we will have a probability p of finding a set of points free of outliers. For example, if we want a probability of success equal to p=99% and the we know that the percentage of inliers in the dataset is w=50%, then we get k=16 iterations, which is much less than the number of all possible combinations that we had to check in the previous example! Also observe that in practice we do not need a precise knowledge of the fraction of inliers but just a rough estimate. More advanced implementations of RANSAC estimate the fraction of inliers by changing it adaptively iteration after iteration.
4d - Perception - Features Algorithm 4: Hough-Transform • Hough Transform uses a voting scheme
4b - Perception - Uncertainty Algorithm 4: Hough-Transform • A line in the image corresponds to a point in Hough space b0 m0
4b - Perception - Uncertainty Algorithm 4: Hough-Transform • What does a point (x0, y0) in the image space map to in the Hough space?
4b - Perception - Uncertainty Algorithm 4: Hough-Transform • What does a point (x0, y0) in the image space map to in the Hough space?
4b - Perception - Uncertainty Algorithm 4: Hough-Transform • Where is the line that contains both (x0, y0) and (x1, y1)? • It is the intersection of the lines b = –x0m + y0and b = –x1m + y1
4b - Perception - Uncertainty Algorithm 4: Hough-Transform • Problems with the (m,b) space: • Unboundedparameterdomain • Verticallinesrequire infinite m