Download
1 / 6

E N D
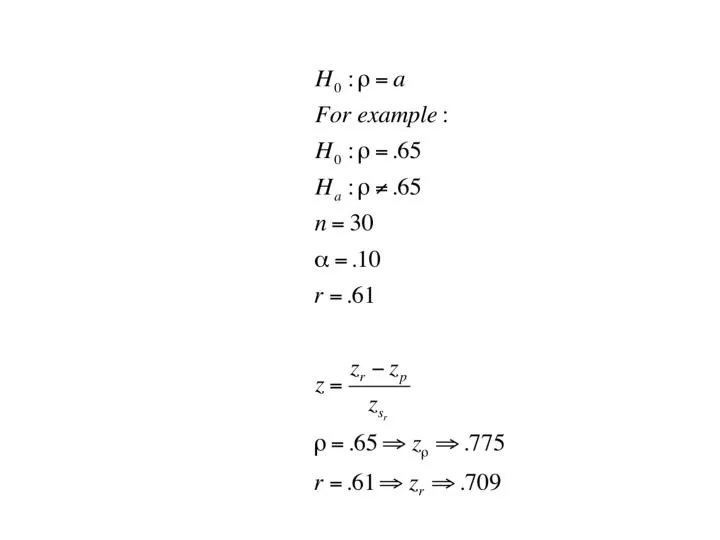
According to the Areas under the standard normal Curve for Values of z (Table C.1 in your text), 36.69% of the area under the curve falls beyond (In this case below) a z score of -.344. Since we are doing a two-tailed test at the alpha = .10 level of significance, we will reject the null hypothesis if the area beyond .344 is less than ,05. Therefore, in this case we will fail to reject the null hypothesis and conclude that we do not have sufficient evidence to say that the population correlation in this example is not .65.
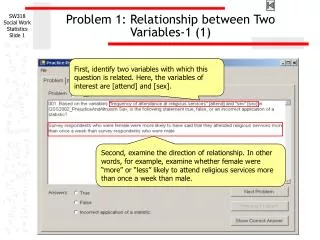
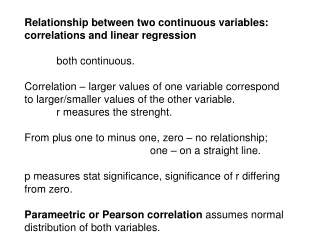
Testing whether there is a relationship between two variables. We can use a t-test to test this null hypothesis against the alternative hypothesis.
r = -.375 n = 32 This is a two tailed t-test with 30 (i.e., n-2) degrees of freedom at the .05 level of significance. According to the able of Crtical Values of the t Distribution, the critical value for this test is tcv = plus or minus 2.042. Our calculated value of t is -3.42 and this is beyond the critical value on the negative side of the curve. Therefore, we reject the null hypothesis and conclude the correlation is different from zero in the population from which this sample was drawn.
Testing hypotheses about the proportion of the occurrence of a dichotomous event.
p = 495/750 = .66 n= 750 alpha = .01 .02% of the scores under the normal curve fall above a value of z = 3.53. This is much less than 1%, so we reject the null hypothesis and conclude that more more than 60% of the voters support the bill. The Senator will vote for it.