Download

1 / 10
100 likes | 217 Views
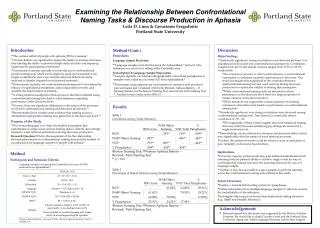
Examining the Relationship Between Two Variables. (Bivariate Analyses). What type of analysis?. We have two variables X and Y and we are interested in describing how a response (Y) is related to an explanatory variable (X).

E N D
Examining the Relationship Between Two Variables (Bivariate Analyses)
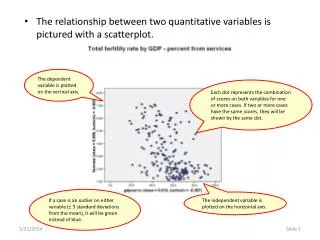
What type of analysis? • We have two variables X and Y and we are interested in describing how a response (Y) is related to an explanatory variable (X). • What graphical displays do we use to show the relationship between X and Y ? • What statistical analyses do we use to summarize, describe, and make inferences about the relationship?
Fit Y by X in JMP Y nominal/ordinal Y continuous X continuous X nominal/ordinal
List of Variables id – ID # for infant & mother headcir – head circumference (in.) leng – length of infant (in.) weight – birthweight (lbs.) gest – gestational age (weeks) mage – mother’s age mnocig – mother’s cigarettes/day mheight – mother’s height (in.) mppwt – mother’s pre-pregnancy weight (lbs.) fage – father’s age fedyrs – father’s education (yrs.) fnocig – father’s cigarettes/day fheight – father’s height lowbwt – low birthweight indicator (1 = yes, 0 = no) mage35 – mother’s age over 35 ? (1 = yes, 0 = no) smoker – mother smoked during preg. (1 = yes, 0 = no) Smoker – mother’s smoking status (Smoker or Non-smoker) Low Birth Weight – infant birthweight (Low, Normal) Example: Low Birthweight Study
Example: Low Birthweight Study(Birthweight vs. Gestational Age) Y = birthweight (lbs.) Continuous X = gestational age (weeks)Continuous
Example: Low Birthweight Study(Birthweight vs. Mother’s Smoking Status) Y = birthweight (lbs.) Continuous X = mother’s smoking status (Smoker vs. Non-smoker) Nominal
Example: Low Birthweight Study(Birthweight Status vs. Mother’s Cigs/Day) Y = birthweight status(Low, Normal)Nominal X = mother’s cigs./day Continuous P(Low|Cigs/Day)
Example: Low Birthweight Study(Birthweight Status vs. Mother’s Smoking Status) Y = birthweight status(Low, Normal)Nominal X = mother’s smoking status (Smoker, Non-smoker)Nominal