Download
1 / 14
150 likes | 175 Views
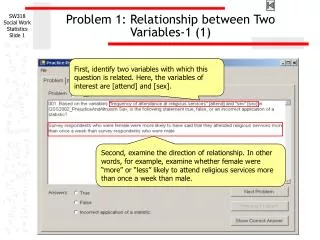
Relations Between Two Variables. Regression and Correlation. In both cases, y is a random variable beyond the control of the experimenter. In the case of correlation, x is also a random variable. In the case of regression, x is treated as a fixed variable. (As if there is no

E N D
Relations Between Two Variables Regression and Correlation In both cases, y is a random variable beyond the control of the experimenter. In the case of correlation, x is also a random variable. In the case of regression, x is treated as a fixed variable. (As if there is no sampling error in x.) Regression: you are wishing to predict the value of y on the basis of the value of x. Correlation: you are wishing to express the degree the relation between a and y.
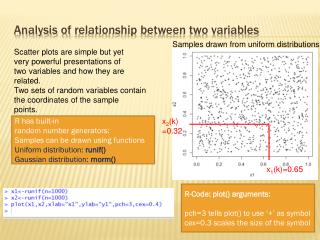
Scatter Diagram or Scatter Plot X axis (abscissa) = predictor variable Y axis (ordinate) = criterion variable Positive Negative Perfect None
Covariance is a number reflecting the degree to which two variable vary or change in value together. n = the number of xy pairs. Using an example of collecting RT and error scores. If a subject is slow (high x) and accurate (low y), then the d score for the x will be positive and the d score for the y will be negative; their product will be negative. If a subject is slow (high x) and inaccurate (high y), then the d score for the x will be positive and the d score for the y will be positive; their product will be positive. If a subject is fast (low x) and accurate (low y), then the d score for the x will be negative and the d score for the y will be negative; their product will be positive. If a subject is fast (low x) and inaccurate (high y), then the d score for the x will be negative and the d score for the y will be positive; their product will be negative.
Illustrative Trends Sub. x y • 100 -200 20 10 -2000 • 200 -100 15 5 -500 • 300 0 10 0 0 • 400 100 5 -5 -500 • 500 200 0 -10 -2000 Those subjects who are fast make more errors. Total = -5000 • 100 -200 0 -10 2000 • 200 -100 5 -5 500 • 300 0 10 0 0 • 400 100 15 5 500 • 500 200 20 10 2000 Those subjects who are fast make fewer errors. Total = 5000 • 100 -200 10 0 0 • 200 -100 5 -5 500 • 300 0 20 10 0 • 400 100 5 -5 -500 • 500 200 10 0 0 There is no trend. Total = 0
Scatter plots of data from previous page. We can see a trend after all. 100 200 300 400 500
Scale Issues (Sec.) (Min.) x y 1 -4 5 -8 32 • -2 13 0 0 5 0 9 -4 0 7 2 17 4 8 Total = 72 9 4 21 8 32 1 -4 300 -430 1920 3 -2 780 0 0 5 0 540 -240 0 7 2 1020 240 480 Total = 4320 9 4 1260 480 1920
Sub X Y • 2 10 • 3 12 • 2 12 • 4 15 • 4 12 What is the covariance? The absolute value of the covariance is a function of the variance of x and the variance of y. Thus, a covariance could reflect a strong relation when the two variances are small, but maybe express a weak relation when the variances are large.
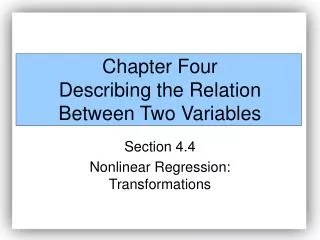
Linear Relation is one in which the relation can be most accurately represented by a straight line. Remember: a linear transformation The general equation for a straight line: (a is the y intercept and b is the slope of the line.) A = 1.5 If x = 8 then, y = .5(8) + 1.5 = 5.5
When the relation is imperfect: (not all points fall on a straight line.) Why are the points not on the line? We draw the “best fit” using what is called the “least-squares” criterion. Why squares? See optional link on simultaneous equations for a closer look at the idea of least-squares.
Regression Line: Example Subject Stat. Score (x) GPA (y) GPA 4 3 2 1 110 120 130 140 Statistics Score
We wish to minimize The predicted value of y for a given value of x = the slope minimizing the errors predicting y = y-axis minimizing the errors predicting y For our example: What does this mean?
Our working example: A = 2.275 – 0.074(125.25) = -7.006 The regression line for our data: Using the regression formula to predict: e.g., x = 124 Note: If the x value you are inserting is beyond the range of the values used to construct the Formula, caution must be used.
Remember: To minimize the sum of the squared deviations about a point, the mean is best. GPA Note: Using our GPA and Statistic Scores data = .79 We could call this a type of Standard Error” of y.
Using only the mean of y to predict y, all y values would be the mean. Using X, Which MODEL is superior? Why? Is there a reliable difference? Standard Error of the Estimate: similar to a standard deviation Where the relation is imperfect, there will be prediction error, whether one use the mean or the regression line. Transformed…. What is r? Residual Variance = What might create residual variance?