Download
1 / 8
80 likes | 514 Views
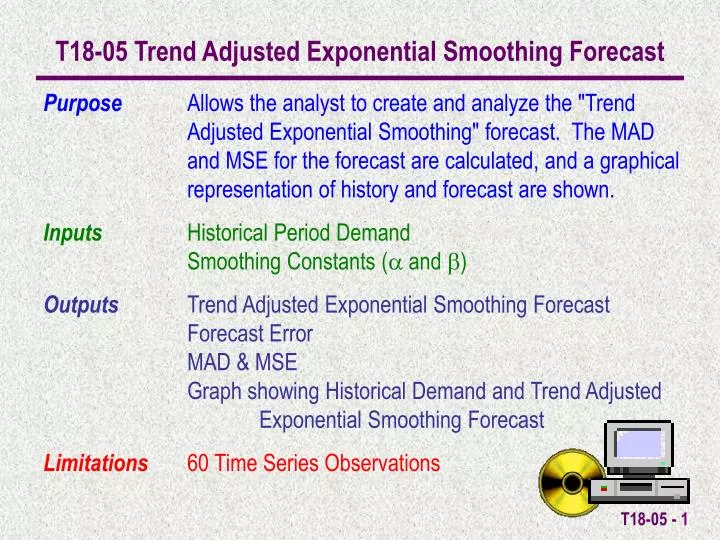
T18-05 Trend Adjusted Exponential Smoothing Forecast. Purpose Allows the analyst to create and analyze the "Trend Adjusted Exponential Smoothing" forecast. The MAD and MSE for the forecast are calculated, and a graphical representation of history and forecast are shown.

E N D
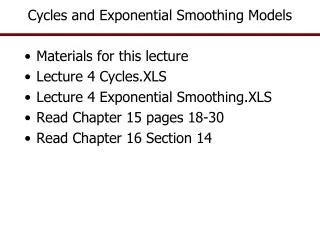
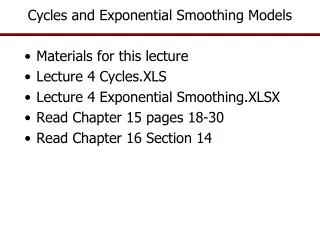
T18-05 Trend Adjusted Exponential Smoothing Forecast Purpose Allows the analyst to create and analyze the "Trend Adjusted Exponential Smoothing" forecast. The MAD and MSE for the forecast are calculated, and a graphical representation of history and forecast are shown. Inputs Historical Period Demand Smoothing Constants (a and b) Outputs Trend Adjusted Exponential Smoothing Forecast Forecast Error MAD & MSE Graph showing Historical Demand and Trend Adjusted Exponential Smoothing Forecast Limitations 60 Time Series Observations
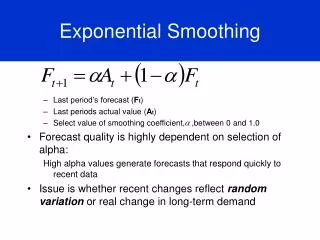
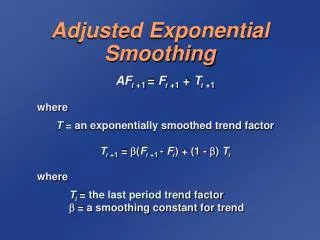
Time Series Techniques Trend Adjusted Exponential Smoothing – forecast is projected based on the trend of the historical data combined with exponential smoothing Horizon: Short range Method: Strength: Ability to track changes in a linear trend Weakness: Not very accurate when a longer forecasting horizon is necessary, lags actual demand. Initial trend is estimated based on 4 starting points, and smoothing constants are chosen through trial.
Forecast Accuracy Given that a forecast is rarely correct, the methodology you choose should be the one which provides the least error from the actual historical demand. Forecasterror is defined as the difference between actual historical demand and the forecast.
Monitoring the Forecast There are two measures used to monitor the accuracy of a forecast. The Mean Absolute Deviation (MAD) and the Mean Squared Error (MSE). TheMADis the average of the absolute value of the forecast errors. The MSE is the average of the squared forecast errors. Note: The formula for the MSE shown above may vary slightly. Some textbooks divide the sum of the squared errors by n-1 rather than n.
Trend Adjusted Exponential Smoothing Example Prepare a trend adjusted exponential smoothing forecast with smoothing constants a = .4 and b = .3. Calculate the trend adjusted exponential smoothing forecast, MAD and MSE.
The Trend Adjusted Exponential Forecast, Error, MAD, and MSE are automatically calculated. Input the History Values, and smoothing constants aandb in the light green cells.
A graph showing the History Values and Trend Adjusted Exponential Smoothing Forecast is automatically produced.