Download
1 / 12
120 likes | 208 Views
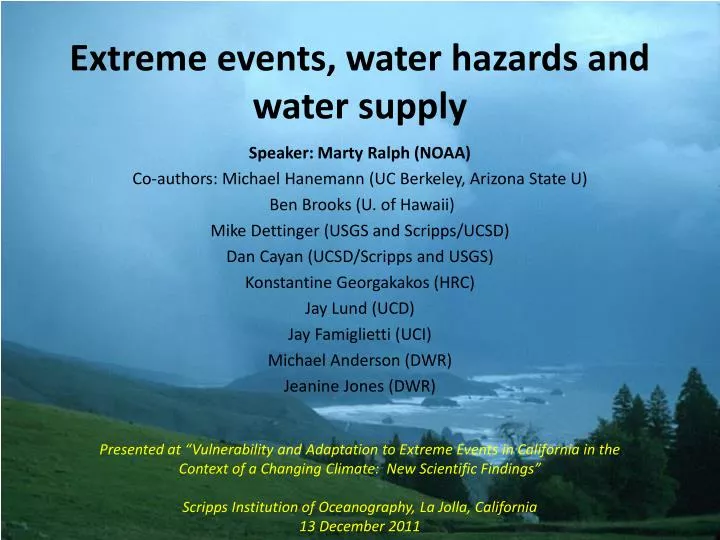
Extreme events, water hazards and water supply. Speaker: Marty Ralph (NOAA) Co-authors: Michael Hanemann (UC Berkeley, Arizona State U ) Ben Brooks (U. of Hawaii ) Mike Dettinger (USGS and Scripps/UCSD ) Dan Cayan (UCSD/Scripps and USGS ) Konstantine Georgakakos (HRC )

E N D
Extreme events, water hazards and water supply Speaker: Marty Ralph (NOAA) Co-authors: Michael Hanemann (UC Berkeley, Arizona State U) Ben Brooks (U. of Hawaii) Mike Dettinger (USGS and Scripps/UCSD) Dan Cayan (UCSD/Scripps and USGS) KonstantineGeorgakakos (HRC) Jay Lund (UCD) Jay Famiglietti(UCI) Michael Anderson (DWR) Jeanine Jones (DWR) Presented at “Vulnerability and Adaptation to Extreme Events in California in the Context of a Changing Climate: New Scientific Findings” Scripps Institution of Oceanography, La Jolla, California 13 December 2011
Important Energy Facilities in the Delta Would Also Be At Risk • The Sacramento - San Joaquin Delta is protected by levees. • Delta islands are below sea level • Energy Facilities: • Underground natural gas reservoirs • Transmission lines • Power plants on the west side of the Delta Source: PPIC 2007
Projections: Upper Colorado River Basin California Water Supply Includes the Colorado River 2025 2055 2085 2025 2055 2085 2025 2055 2085 • Temperature increases • Precipitation variable • Runoff is earlier in the season and totals decrease by 6–20% Sources: CO Climate Report, 2008; Christensen and Lettenmeier, 2007
Heavy Precipitation and Flooding Flooding on the Russian River, Guerneville, CA California averaged $370 M/year in flood damages 3rd highest in the nation Total Damage in Period 1983-1999 (1995 $ equivalent)
CALIFORNIA’S STORMS ARE AS BIG AS ANY IN THE COUNTRY! LARGEST 3-DAY PRECIPITATION TOTALS, 1950-2008 Ralph, F.M., and Dettinger, M.D., in press, Historical and national perspectives on extreme west-coast precipitation associated with atmospheric rivers during December 2010: Bulletin of the American Meteorological Society, (in press, Nov 2011)
Atmospheric Rivers in IPCC-AR4 climate-change projections by 7 modern GCMs Obs case • By end of 21st Century, most GCMs yield: • More atmospheric vapor content, but weakening westerlies • Net increase in “intensity” of extreme AR storms • Warmer ARs (+1.8 C) snowline raised by ~ 1000 feet on average • Lengthening of AR seasons (maybe?) Water Vapor & Low-Level Winds Dettinger, M.D., 2011, Climate change, atmospheric rivers and floods in California—A multimodel analysis of storm frequency and magnitude changes: Journal of American Water Resources Association, 47, 514-523.
Adaptation • Central Valley Flood Protection Plan • Scenario development • Drought Scenario: (Harouetal. 2010, Water Resources Research) • Storm/flood scenario: “ARkStorm” (Dettinger et al. 2011, Natural Hazards) • Forecast-Based reservoir Operations (see Willis et al. 2011, San Francisco Estuary and watershed Science) • Better storm and runoff predictions are a potential adaptive strategy
Central Valley Flood Protection Plan “Thresholds Approach” Assess Human, Infrastructure and Economic Vulnerabilities Assess Vulnerability & Consequences Identify Causal Meteorological and Hydrological Conditions Assess Likelihood of Exceedence Assess Likelihoods Assess Vulnerability & Consequences Identify Causal Conditions Assess Vulnerability & Consequences Identify Causal Conditions Central Valley Flood Management Planning Program, 2011, Climate Change Analysis: Attachment 11, 2012 Central Valley Flood Protection Plan, 76 p. (Courtesy of Mike Anderson, CA-DWR)
ARkStorm Severe Storm Scenario • A USGS-led emergency preparedness scenario • Dozens of scientists and engineers contributed • Shaped by real past events incl. 1986, 1969, and 1861/62 • Economic impacts estimated to be >$500 B • Methods and results were peer reviewed Dettinger, M.D., and co-authors, 2011, “Design and quantification of a severe winter storm scenario for emergency preparedness and planning exercises in California.” Natural Hazards, in press, 27 p.
Atmospheric Rivers, Floods and the Water Resources of California by Mike Dettinger, Marty Ralph, , Tapash Das, Paul Neiman, Dan Cayan Water, 2011 (June) 25-35% of annual precipitation in the Pacific Northwest fell in association with atmospheric river events An average AR transports the equivalent of 7.5 times the average discharge of the Mississippi River, or ~10 M acre feet/day 35-45% of annual precipitation in California fell in association with atmospheric river events
Conclusions • California has significant vulnerabilities to shifts in extreme precipitation and runoff • Reduced snow pack is a key risk to water supply, as are reductions in Colorado River flow and inundation of the Delta • Changes in the strength of atmospheric rivers and in snow level are key to future flood risks • Improving monitoring and prediction of critical hydrometeorological conditions can enable adaptation to a changing climate such as by modernizing reservoir operations methods