Download
1 / 32
330 likes | 558 Views
Unit 1 Intro to Chemistry and Measurement. Intro to Chemistry and Physics Mr. Patel SWHS. Topic Outline. Learn Major Elements and Symbols Intro to Chemistry (1.1, 1.2) Significant Figures (3.1) Measurement (3.1, 3.2) Factor-Label Method of Conversions (3.3). Intro to Chemistry .

E N D
Unit 1Intro to Chemistry and Measurement Intro to Chemistry and Physics Mr. Patel SWHS
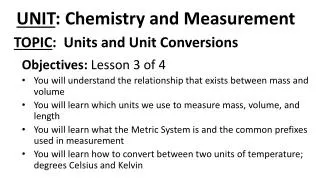
Topic Outline • Learn Major Elements and Symbols • Intro to Chemistry (1.1, 1.2) • Significant Figures (3.1) • Measurement (3.1, 3.2) • Factor-Label Method of Conversions (3.3)
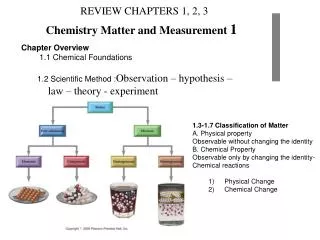
Intro to Chemistry • Matter – anything that has mass and occupies space • Chemistry – study of the composition of matter and the changes it undergoes
Intro to Chemistry • Chemistry affects all aspects of life and other natural events! • Food Digestion • Leaves changing colors • Muscle contraction • Driving cars
Intro to Chemistry • Five different areas or branches of chemistry
Organic Chemistry • Study of all chemicals containing carbon
Inorganic Chemistry • Study of chemicals that do not contain carbon
Biochemistry • Study of processes that occur in living things
Analytical Chemistry • Study that focuses on the composition of matter
Physical Chemistry • Area that deals with the rate, mechanism, and energy transfer of chemistry
Types of Research • Pure Chemistry – increase chemical knowledge • Applied Chemistry – goal oriented
History of Chemistry • Alchemy - change other metals to gold • Lavoisier – Father of Modern Chemistry • Observation to measurement
Significant Figures • Sometimes we estimate numbers • If we measure between 9.8 and 9.9, we may say it is 9.85. • We know that the 9 and 8 are definite; 5 is estimated. • Discuss accuracy/precision later • Significant Figures – the digits from a measurement that are known precisely plus an estimated digit
Measurement • Measurement – quantity with a number and unit • Accuracy – how close you are to the true value • Precision – how close your measurements are to one another
Scientific Notation • Used for very large or very small numbers • Converts a single number to a product of two numbers • Ex: 8000 8 x 10³ • Ex: 0.234 2.34 x 10⁻¹
Scientific Notation Practice • 252 • 125000 • 0.00305 • 0.00000000548 • 2.52 x 10² • 1.25 x 10⁵ • 3.05 x 10⁻³ • 5.48 x 10⁻⁹
International System of Units (SI) • Five SI base units: • meter (length) • kilogram (mass) • Kelvin (temperature) • Second (time) • Mole (amount)
Factor-Label Method • Write down starting and ending unit • Write all relevant conversion factors • Cancel units to get to end unit • To cancel a unit, the unit must be on the top and bottom
Presenting Data • Data – numbers obtained or observations made during the experiment • Organize data so that it is easier to read • Organize data with graphs and tables
Data Tables • Simplest way to organize data • Purpose: to show pure data. • Table has a Title, category titles, and units.
Bar Graph • Purpose: compare a set of measurements
Circle Graph • Purpose: to show parts out of a whole • Circle Graph has a title, axis labels, and bars that show data
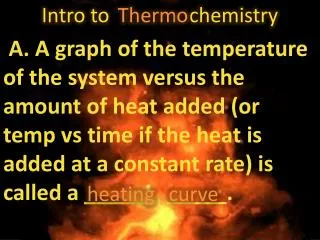
Line Graphs • These lines are very important: slope • slope = Rise/Run • Proportional graphs • Inverse graphs • Always has Title, Axis Labels with units, any relationships.
Variables • Independent Variable – what is being changed by the researcher • Always along the x-axis of a graph (horizontal) • Time is usually always independent variable • This will cause something to happen
Variables • Dependent Variable – the factor that is changing because of what the researcher changed • Always along the y-axis on a graph (vertical) • This is the response to the independent variable
Correlation • Line Graphs can show a positive or negative correlation. • This is correlation NOT causation • We can not say one thing causes another • One thing may lead to another