Download
1 / 29
290 likes | 400 Views
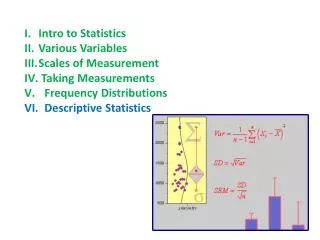
Unit 1 – Intro to Statistics. Terminology Sampling and Bias Experimental versus Observational Studies Experimental Design. Statistics. Set of methods used to describe and make inference on data. Numbers that describe a set of data that is drawn from a population. Population.

E N D
Unit 1 – Intro to Statistics Terminology Sampling and Bias Experimental versus Observational Studies Experimental Design
Statistics • Set of methods used to describe and make inference on data • Numbers that describe a set of data that is drawn from a population
Population • Set of all measurements of interest to an experimenter
Sample • Subset of the population • Need to be careful to ensure that it is representative of the population • A sample is biased if in some important way it does not represent the population • We can avoid bias by incorporating randomness into the selection process (more on this later)
Numerical Measurements Population Sample Statistic Sample Mean x-bar Sample Standard Deviation s • Parameter • Population Mean μ • Population Standard Deviation σ
Types of Data Quantitative Data (numeric) Qualitative Data (categorical) Can be classified and separated into different categories that are distinguished by some nonnumeric characteristic • Discrete – finite number of values or infinitely countable • Continuous – infinitely uncountable, covers an interval of values w/o gaps
Uses of Statistics • Education • Psychology • Sociology • Sports • Science • Medical • Political • And Many More • Descriptive • Inferential
Misuse of Statistics • Sample Bias • Graphs designed to be misleading • Use of methods for inappropriate situations (required conditions not met) • Incorrect conclusions (correlation vs causality, confounding/lurking variables and more)
Levels of Measurement • Nominal – categorical data that cannot be ordered (eg. Gender) • Ordinal – data can be ordered but differences are meaningless (eg. Letter grades) • Interval – similar to ordinal data but differences are meaningful. Zero does not mean absence of quantity. Ratios are not meaningful (eg. Temperature) • Ratio – zeros and ratios are meaningful
Sampling Bias • Simple random sample (SRS) where every element in the population has an equal chance of being selected. • This can be done with random number generators found in texts, calculators, computer programs • Types of bias: non random, non response, self selected, loaded questions, small sample size
Designing Our Study • Experimental – researcher uses randomization to assign subjects to appropriate groups (treatment vs control) eg Salk vaccine in the 1950s • Observational study – no choice as to which subjects are assigned into tratment/control groups (smoking studies)
Experimental vs Observational • Experimenter can control conditions so that an “effect” can be observed on the response • Completely randomized design (blind, double blind) • Completely randomized block design (paired data) • Use only if it is unethical or impossible to impose treatment or if it unnecessary to impose treatment • Can be confounded with other variables • Cannot say that a treatment “causes” a certain response
Confounding • Confounding occurs when the researcher is not able to determine which factor (often one planned and one unplanned) produced an observed effect. • For example, if a restaurant tries adding an evening buffet for one week and it is the same week a nearby theatre happens to show a real blockbuster that attracts unusual crowds to the area, the restaurant can not know whether its increased business is due to the new buffet or the extra traffic created by the theatre.
Samples • Ensure that the sample is large enough • Ensure that the sample is representative of the population • Randomization • Random sample means that every element in the population has an equal chance of being selected • Simple random sample (SRS) means that every sample of size n has an equal chance of being selected
Randomization • Random number generators found on computers, calculators, tables of random numbers
Randomization • How would we select a random sample of size 200 from our school? • Write each student’s name on a slip of paper, place slips in a box, mix thoroughly then select 200 of them. • Assign each student to a number (ID number, last 4 digits), use a random number generator to generate 200 random numbers to identify the students selected
Types of Samples • Systematic sample – choose every kth element in the population • Convenience • Stratified – population is divided into strata and a sample is selected from each strata • Cluster - population is divided into clusters, clusters are randonly selected and all elements from those clusters are sampled
Question 25 a. Stratified samples result in random samples only if the sample size for each stratum is proportional to the size of the stratum. If the strata are all the same size, then use the same sample size for each. If one strata is half the size then its sample size should be half of the other samples. It will never result in a SRS b. If there each element is in only one cluster, then yes, a random sample occurs. The chance that an element is selected is the chance its cluster is selected. But it will never result in a SRS