Download
1 / 15
150 likes | 282 Views
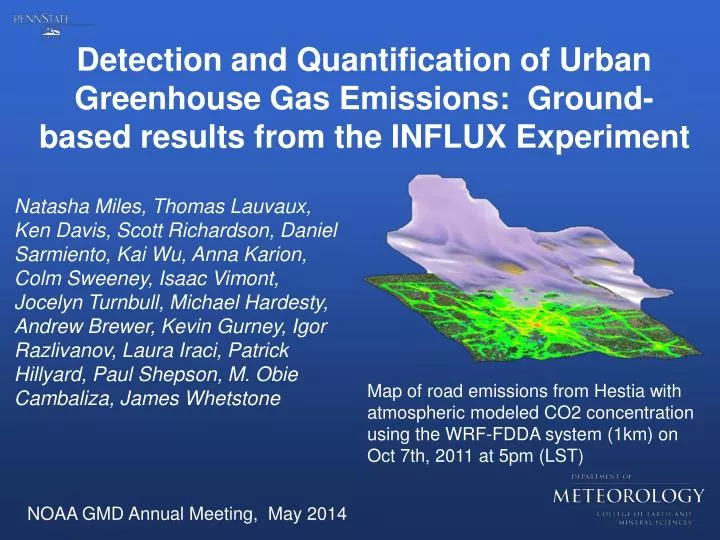
Detection and Quantification of Urban G reenhouse Gas Emissions: Ground-based results from the INFLUX Experiment.

E N D
Detection and Quantification of Urban Greenhouse Gas Emissions: Ground-based results from the INFLUX Experiment Natasha Miles, Thomas Lauvaux, Ken Davis, Scott Richardson, Daniel Sarmiento, Kai Wu, Anna Karion, Colm Sweeney, Isaac Vimont, Jocelyn Turnbull, Michael Hardesty, Andrew Brewer, Kevin Gurney, Igor Razlivanov, Laura Iraci, Patrick Hillyard, Paul Shepson, M. Obie Cambaliza, James Whetstone Map of road emissions from Hestia with atmospheric modeled CO2 concentration using the WRF-FDDA system (1km) on Oct 7th, 2011 at 5pm (LST) NOAA GMD Annual Meeting, May 2014
Goals of the Indianapolis Flux Experiment (INFLUX) • Develop and assess methods of quantifying greenhouse gas emissions at the urban scale, using Indianapolis as a test bed. • In particular: • Determine whole-city emissions of CO2 and CH4 • Measure emissions of CO2 and CH4 at 1 km2 spatial resolution and weekly temporal resolution across the city • Distinguish biogenic vs. anthropogenic sources of CO2 • Quantify and reduce uncertainty in urban emissions estimates
Atmospheric measurement of GHG emissions • Compare to “Bottom-up” inventories using economic data and emissions factors • Atmospheric methods have the potential to provide independent emissions estimates • Measure GHG concentrations upwind and downwind of a source • Model atmospheric transport (wind, mixing depth) • Use an inversion to minimize the difference between modeled and observed GHG concentrations Steps CO2, CO, CH4
Vulcan and Hestia Emission Data Products • Vulcan – hourly, 10km resolution for USA • Hestia – hourly, 250 m resolution for Indianapolis, sector by sector Kevin Gurney Arizona State Univ http://hestia.project.asu.edu/
INFLUX GROUND-BASED NETWORK • Communications towers ~100 m AGL • Picarro, CRDS sensors • 12 measuring CO2, 5 with CH4, and 5 with CO • NOAA automated flask samplers • NOAA LIDAR • Eddy flux at 4 towers Predominant wind direction
High resolution inversion modeling system • Atmospheric model WRF-Chem: 9km/3km/1km (nested mode) • Model physics • Simple urban scheme within the NOAH Land Surface Model with the MYNN PBL scheme • Coupled to Lagrangian Particle Dispersion Model (Uliasz, 1995) • Bayesian Kalman matrix inversion • Model assessment • 4 eddy flux towers • NOAA HALO and HURDL Doppler Lidars • Aircraft data • Radiosonde campaign: 9-17 June
Tower observations: [CO2] at INFLUX sites • Afternoon [CO2] with 21-day smoothing • Seasonal and synoptic cycles are evident • Site 03 (downtown): high [CO2] • Site 01 (background): low [CO2] 2011 2012 2013
Tower observations: [CO2] at INFLUX sites • Afternoon [CO2] with 21-day smoothing • Seasonal and synoptic cycles are evident • Site 03 (downtown): high [CO2] • Site 01 (background): low [CO2]
Spatial Structure of Urban CO2Average [CO2] above background site • Site 09 measures 0.3 ppm larger than Site 01 (on average; changes with wind direction) • Site 03 (downtown site) measures larger [CO2] by 3 ppm Eastern edge of city Downtown East of city Afternoon daily values, 1 Jan – 1 April 2013
Inversion results: spatial pattern of flux correction • Spatial pattern of emissions corrections (in %) • Prior: Hestia 2002 • Tower observations for Sept – Dec 2012 • Inversion decreased emissions by up to 15% compared to Hestia 2002 in downtown region Lauvaux et al, in prep
Inversion results: spatial pattern of flux correction • Prior: Hestia 2012 • Tower observations for Sept – Dec 2012 • Corrections of -5 to +5% rather than up to 15% change when using Hestia 2002/2011 as a prior Lauvaux et al, in prep
Inversion results • Using 2012 tower data • Inversion with different priors • Hestia 2002 • Hestia 2011 • Hestia 2012 • Inversion converges to value towards 2012 values Hestia 2002: 1350 ktC Post using Hestia 2002: 1280 ktC Hestia 2011: 1345 ktC Post using Hestia 2011: 1274 ktC Hestia 2012: 1233 ktC Post using Hestia 2012: 1203 ktC Dec 2012 Sept 2012 Lauvaux et al, in prep
How different is the emissions estimate using a different prior? • ODIAC nightlight-based CO2 emissions product (Tomohiro Oda) • Uses national petroleum and natural gas usage as total and distributes using nightlight data from satellite • Also incorporates power plant database • Available 1992 – 2012 worldwide
Hestia vs CDIAC Nightlight emissions product as prior Odiac 2012: 1293 ktC Post using Odiac 2012: 1290 ktC Hestia 2012: 1233 ktC Post using Hestia 2012: 1203 ktC Sept 2012 Dec 2012 Posterior results are the within 10% of each other throughout the period, and 7% different overall
NACP Conclusions • Tower observations detect a clear urban signal in CO2 (buried amid lots of synoptic “noise”).Differences vary greatly with weather conditions. • Inversion converges to value towards Hestia 2012, whichever version of prior estimate is used • For more information, see http://influx.psu.edu