Download
1 / 25
250 likes | 379 Views
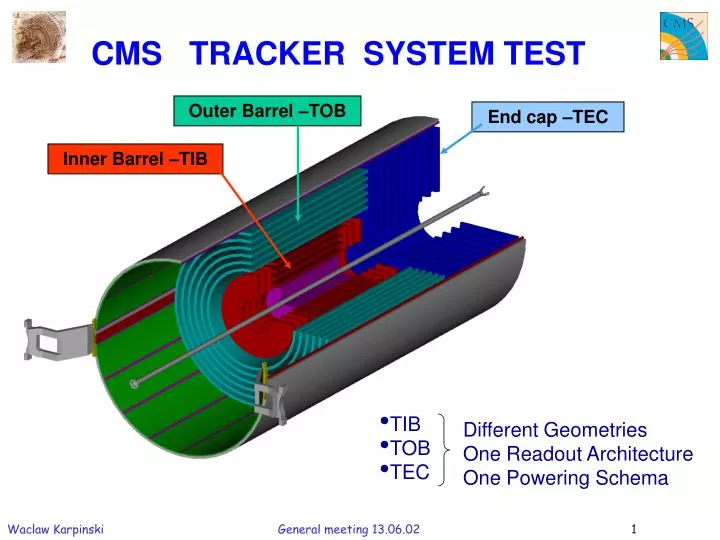
CMS TRACKER SYSTEM TEST. Outer Barrel –TOB. End cap –TEC. Inner Barrel –TIB. TIB TOB TEC. Different Geometries One Readout Architecture One Powering Sch e ma. Power Supplies and Cables. Power supplies Situated in counting room I mplement a u nipolar scheme

E N D
CMS TRACKER SYSTEM TEST Outer Barrel –TOB End cap –TEC Inner Barrel –TIB • TIB • TOB • TEC Different Geometries One Readout Architecture One Powering Schema
Power Supplies and Cables • Powersupplies • Situated in counting room • Implement a unipolar scheme • PS modules power groups of ~60APV • I@2.5V =10A, I@1.25V=4A I@0V =14A • Each PS module equipped with 2 HV channels for detector bias • FloatingLV, HV power supplies of each power group, their Return • Lines connected inside the detector to the Common Detector Ground • Power Cables 140 m long • Voltage drop = 5V • Use of sens wires to compensate the voltage drop • Multipolar cable with low inductance , high capacitance to minimize voltage overshoots due to current variations
Definition of the System Test • The tracker has to enter its production phase • Need to validate a complete subset of it • Validate designs • Tune design details • Verify/optimize integration of components Focus is not on component characterization, but on overall system performance • The subsets: (for TIB/TOB/TEC) • A number of final modules (sensors +frontend hybrid) • integrated on the final mechanical support structure equipped with: • interconnectboards • optical digital links and electronics for control • optical analogue links for readout • power supplies + 100m MSCable • cooling
What is necessary to prove it works • Modules • Noise • Physics signals (ß-source, Laser), SNR • APV settings • Detector leakage currents • Compare with corresponding measurements taken with individual • modules in the “single module setup” (i.e. electrical readout) • Analogue readout chain • Optical link gain and bias point • timing alignment of moduls • Noise contributions, Crosstalk, Common mode effects • Operation margin • Control chain • Noise immunity ( Grounding, cabling, shielding) • Operation margin • Redundancy • Long Term Stability and Temperature stability of the system
What is necessary to prove it works • Interconnect boards, mother boards • Signal Integrity • the distribution of the fast control signals: clock, reset and back plane pulses, • Power distribution • voltage drops; uniformity of supply voltage distribution • Behaviour of full loaded system due to sudden variation in current consumption in correlation with: • large inductance of the long cables • slow reaction time of PSU • Protection against over-voltage?
What is necessary to prove it works • Mechanics • mechanical compatibility of the various components with the mechanical support structure • mechanical stress of the modules due to their fixation on cooling system and interconnect boards • Deformation upon cooldown due to different CTE´s • Ambient parameters • temperatures of the modules • temp. of various elements • humidity in several spots
Phase 1 (April-July):Readout of 1 to 6 modules with a complete (analog & digital) optical link; test with prototype PSUs with long cables. Phase 2 (July-December): mechanical and electrical integration and tests of a small part of TIB: 6 double sided modules on Layer #1 cylinder 12 single sided modules on Layer #3 cylinder Tracker Inner Barrel System Test
Tracker Inner Barrel System Test LAB set-up in Florencecopper readout : UTRI+FEDoptical readout: Opto Hybrid + Fiber + Opto Receiver + Diff. Buffer +FED PC with FED, FEC and TSC CCU Detector and Opto Hybrid Interface Board (UTRI)
Copper Readout Noise 1.47 ADC NCh/bin 60 ADC AD counts T(ns) AD counts Optical Readout Optical Readout AD counts NCh/bin 57 ADC • Noise • 1.18 ADC AD counts T(ns)
Tracker Inner Barrel System Test Signal to noise • Signal equivalent to roughly 2 MIPs • Copper readout: S/N =42 • Optical readout: S/N =48
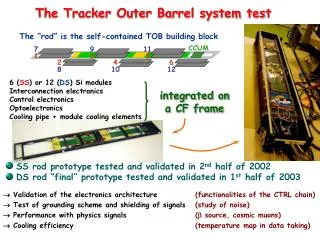
Tracker Outer Barrel System Test Patch panel InterConnect Bus Cooling pipe Module frame Module support blocks The rod components InterConnect Cards 110 cm 15 cm
Tracker Outer Barrel System Test • Detailed electrical test of IC bus + IC cards, with 12FE- Hybrids and • 8 OptoHybrids (almost full load) • Check of the signal integrity • Optimization of the impedance matching • Measurement of the voltage drop along the bus • Test of I2C communication • Results • The design of IC Bus and IC Cards is correct – signals are very clean • A few details have been fixed/optimized • Optical link commissioned on a single channel setup • Nominal gain of the link verified • Optimization of the bias point
Tracker Outer Barrel System Test Next step: Integrate a rod with electrical components and real modules Build an Alu box, gas tight, with patch panel for pipes (cooling and dry air) and other services (It can house 2 rods) Add external temperature and humidity probes Commission a cooling system with C6F14
Tracker Outer Barrel System Test Current status: • All modules working properly and read out under bias • External temperatures probes also read out • Cooling running smoothly • Grounding scheme similar to the “final” one implemented • Now ready to start quantitative measurements Further steps • Study sensitivity to noise on the power lines / grounding • Go to the tracker operating temperature • Install 12 detectors in the second rod (DS rod) • Add a second rod
Tracker Endcap System Test Front petal • 28 Si-detectors • 28 FE hybrids • 28 Optohybrids • 2 CCUM • 4 IC Boards B-side A-side front petalback petal 3 power groups : 1. Ring #1, #2 48 APVs 24 APVs 2. Ring #3, #4, #6 44 APVs 32 APVs 3. Ring #5, #7 44 APVs 56 APVs
Tracker Endcap System Test • Design verification of petals • mechanics, done • electrical performance of the interconnect board, done • deformation after cooldown tested • System test in 4 steps: • Test of the 2nd detector group (rings #3, #4, #6) • Test of the 3rd detector group (rings #5, #7) • Fully equipped but without Si-Sensors, • Test of the 1st detector group (rings #1, #2) • Fully equipped but without Si-Sensors, • Results expected by the end of this year • Full System Test for Front and Back petal • fully equipped with Sensors and front end electronics • with final cables and power supplies • Final results expected in spring 2003
Tracker Endcap System Test Test of the mechanical compatibility Digital Optical Hybrid R#7 Interconnect Board R#6 Analogue Optical Hybrid R#5 R#4 Frontend Hybrid R#3 R#2 R#1
Tracker Endcap System Test Signal Integrity Differential Bunch Clock Pulse Reset Pulse • Over-voltage measurements • Behaviour of full loaded system due to sudden variation in current consumption (switching off the frontend hybrids) • over-voltage swing due to inductance of the long cables • over-voltage gradient due to slow reaction time of the PSU
Tracker Endcap System Test Setup for the Measurements of the Over-voltage
Overvoltage measurements C250 = 60 µF, C125 = 40 µF • Over-voltage swing due to • cable inductance • Commercial power supplies • Sense wires not connected • Cable Length = 100m • Different dumping capacitances V2.50 V1.25 I250 = 1.2 A I125 = 0.52A C250 = 330 µF, C125 = 330 µF C250 = 740 µF, C125 = 740 µF V2.50 V2.50 V1.25 V1.25 I250 = 1.0 A I125 = 0.52 A I250 = 2.75 A I125 = 0.84 A
Over-voltage measurements • Overvoltage gradient • due to slow regulation time of PSU • senses wires connected • commercial power supply • dumping capacitance 700µF • cable 100m, U = 0.8V • 4 frontend hybrids toggled; I = 2A • Overvoltage .4 V above the limit • Over voltage is a potential problem. • Overvoltage gradient requires : • special power supply design or • radhard voltage limiter located close to detector • could be reduced by proper system architecture • Overvoltage swing could be fixed by: • reasonable damping capacitance on the interconnect boards
Conclusions and Remarks • System test is underway for TIB/TOB/TEC • The goal is to test an overall performance of a complete subsystem: • Si-Modules + FE-electronics • / analogue optical links / digital control links /long cables / • power supplies /monitoring • It´s intended to be a step by step process • All sub-components will be integrated as soon as they are • made available • First TOB Rod is integrated, ready to start quantitative • measurements • Final results for all detectors are expected by the • beginning of 2003