Download
1 / 11
110 likes | 114 Views
Graphing (Just the basics...). Graphs. What are Graphs? Why do scientists use them? What other professional use graphs? Why in the world would anyone WANT TO use graphs?. 3 Types. Line Graphs. The type most used on the Regents (99% of the time!) is a LINE GRAPH!. Rules for Line Graphs.

E N D
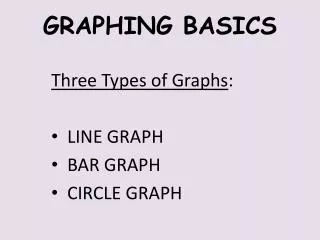
Graphs • What are Graphs? • Why do scientists use them? • What other professional use graphs? • Why in the world would anyone WANT TO use graphs?
Line Graphs • The type most used on the Regents (99% of the time!) is a LINE GRAPH!
Rules for Line Graphs • Give your graph a Title • What are you graphing? • Label BOTH axes (X & Y) • Which one is the X axis? • Which one is the Y axis? • Label Appropriate Scale (Spaced EVENLY) • Use a key if plotting more than one source of data
Steps to follow • USE A PENCIL! • Label the horizontal and vertical axes • Independent Variable on the horizontal (HIV) • Dependent Variable on the vertical • Do NOT forget the units! • Number the horizontal and vertical axes • What is the largest number you need for your data? • How many lines are available? (Count ‘em!) • Can you skip any lines to spread the graph out? • Plot the data points (use small dots, NOT BASEBALLS!) • Connect the data points if told to do so • Title the Graph
Variables • Independent Variable (HIV) • This is what the experimenter CHANGES in the experiment • Sometimes called the Manipulated Variable • Goes on the X-axis! (Horizontal) • Dependent Variable (DVV) • The variable that is measured • Goes on the Y-axis! (Vertical)
Let's try it.... • Plot the following information on the graph and answer the questions... • What should the title be? • What are the two variables? • What is the unit for time? • What is the unit for temperature?
Let's try it....again! • Plot the following information on the graph and answer the questions... • What is the unit for rainfall? • Create a key!