Download
1 / 23
230 likes | 237 Views
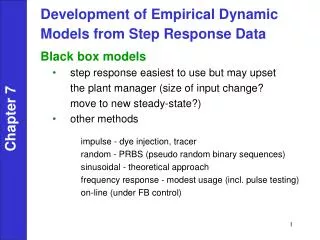
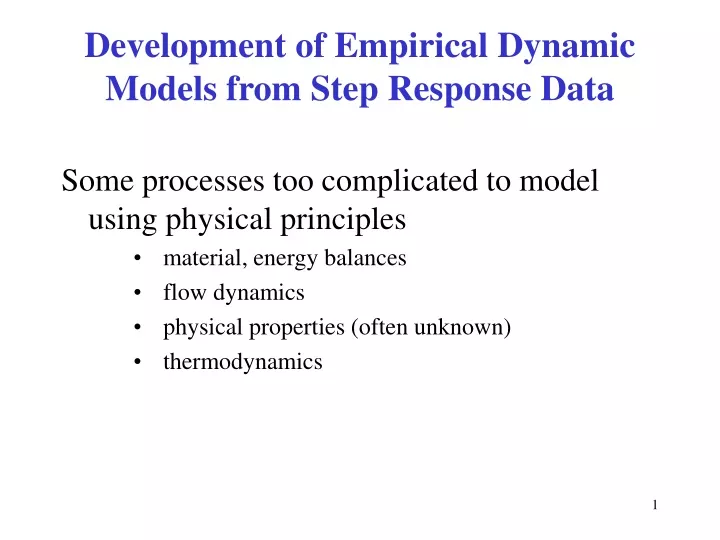
Development of Empirical Dynamic Models from Step Response Data. Some processes too complicated to model using physical principles material, energy balances flow dynamics physical properties (often unknown) thermodynamics. Black Box Models. Step Input.

E N D
Development of Empirical Dynamic Models from Step Response Data Some processes too complicated to model using physical principles • material, energy balances • flow dynamics • physical properties (often unknown) • thermodynamics
Step Input • Step response is the easiest to use but may upset the plant manager • Other methods • impulse - dye injection, tracer • random - PRBS (pseudo random binary sequences) • sinusoidal - theoretical approach • frequency response - modest usage (incl. pulse testing) • on-line (under FB control)
Chapter 7 (θ = 0)
Fitting of FOPDT Model • For a 1st order model, we note the following characteristics in step response: • The response attains 63.2% of its final response at one time constant (t = ). • The line drawn tangent to the response at maximum slope (t = ) intersects the 100% line at (t = ). • There are 3 generally accepted graphical techniques for determining the first-order system parameters and . Chapter 7
Method 1: Sundaresan & Krishnaswany (1978) • Find K from stead-state response. • Normalize step response by dividing all data with KM (t = 0, y = 0; t →∞, y = 1) • Use 35.3% and 85.3 % response times (t1 and t2), i.e. • Calculate q = 1.3 t1 – 0.29 t2 t = 0.67 (t2 – t1) Chapter 7
Method 3: Fitting an Integrator Model to Step Response Data In Chapter 5 we considered the response of a first-order process to a step change in input of magnitude M: Chapter 7 For short times, t < t, the exponential term can be approximated by so that the approximate response is:
is virtually indistinguishable from the step response of the integrating element In the time domain, the step response of an integrator is Chapter 7 Hence an approximate way of modeling a first-order process is to find the single parameter that matches the early ramp-like response to a step change in input.
Chapter 7 Figure 7.10. Comparison of step responses for a FOPTD model (solid line) and the approximate integrator plus time delay model (dashed line).
Harriot’s Method 0.73 Chapter 7 1.3
0.39 0.26
Smith’s Method 20% response: t20 = 1.85 60% response: t60 = 5.0 t20 / t60 = 0.37 from graph Chapter 7 Solving,