Download
1 / 15
150 likes | 157 Views
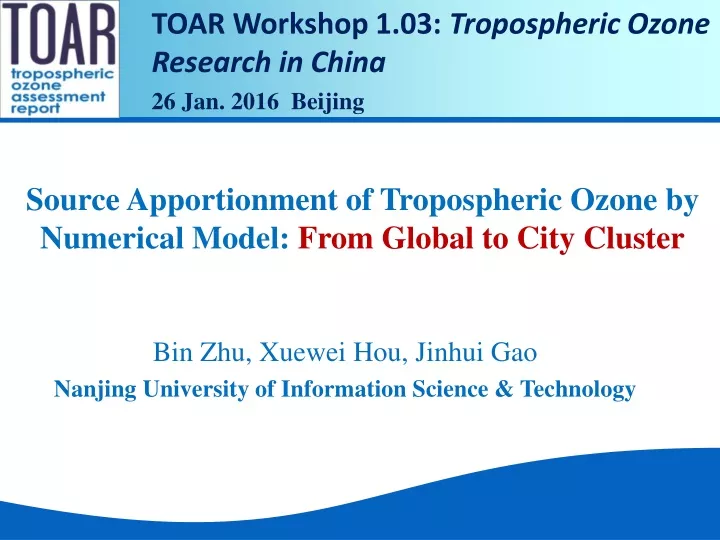
TOAR Workshop 1.03: Tropospheric Ozone Research in China 26 Jan. 2016 Beijing. Source Apportionment of Tropospheric Ozone by Numerical Model: From Global to City Cluster. Bin Zhu, Xuewei Hou, Jinhui Gao Nanjing University of Information Science & Technology. List of contents.

E N D
TOAR Workshop 1.03: Tropospheric Ozone Research in China 26 Jan. 2016 Beijing Source Apportionment of Tropospheric Ozone by Numerical Model: From Global to City Cluster Bin Zhu, Xuewei Hou, Jinhui Gao Nanjing University of Information Science & Technology
List of contents • Introduction to Source Apportionment methods • Ozone tagging in a Global Chemistry Model: MOZART-4 • Ozone tagging in a regional air quality Model: WRF-Chem • Conclusion & Remarks
Introduction to the Methods Aim:Response of the Receptors to Sources • Sensitivity experiments :switch on/off the emissions or perturb the emissions (Wild, 2001) Disadvantage: nonlinearity of chemistry (Wu,2009,GRL) larger computer resource • Tracer-Tagging Method (Wang 1998;Sudo 2007;Li &Wang 2007 ) Advantage: Decrease the errors caused by the nonlinearity One simulation in stead of multiple runs
Implement 2Tagged O3 into Global Model MOZART-4 Hou & Zhu, 2014, Atmos. Environ. Tagging Ozone by Species Tagging ozone by regions Emmons (2012) : quantify contributions of ozone by “tagging” emissions of NO and its resulting products and following them to the production of ozone. Wang(1998a, 1998b), Sudo (2007):The Chemical tendency of Ox produced in the region i is given as: Ox=O3+ O +O(1D) + NO2+ 2NO3+ 3N2O5+ PANs + HNO3 Qi: mixing ratio of Ox tagged by the region i β: the chemical loss rate constant Pi the gross chemical production within the region i. : inside region i : outside region i
The additional sets of sensitivity experiments 2.8°×2.8°, with 28 levels Hou&Zhu, 2014, Atmos. Environ. Emmons et al., 2012, Geosci. Model Dev.
Spring Maximum O3 sources along EA Pacific Rim 8ppbv The contribution rates at 35°N: BL Japan (local, 25.1%), stratosphere (19.2%), BL China (14.2%), BL Europe (8.1%), FT Europe (6.1%), BL North American (4.7%), FT North American (3.5%), FT China (2.6%), FT Japan (1.5%), Mid-latitude high ozone in spring mostly due to regional photochemical production.
Reasons of spring O3 peak in mid-latitude east Asia Pacific rim mostly due to regional photochemical productions — 2 tagging agree well Regions in MOZART NO from China 8ppb 8ppb O3 contribution rate of region-tagging O3 contribution of NO-tagging ,China
Implement Tagged O3 into regional Model WRF-Chem In comparison with large-scale research in global models,regional-scale O3 source apportionment requires not only tagging ozone itself, but also tracking its precursors (NOx and VOCs). We should track both ozone and its precursor emitted from each geographical source region and calculates all the levels of ozone with identities within one simulation. HCHO/NOy < 0.28 The ozone production process is NOx-limited The ozone production process is NOx-limited VOC-limited Transition-band HCHO/NOy > 0.28 NOx-limited
O3 source apportionment under frequent wind-shifting over the YRD High ozone episode:May 19-26, 2013; Gao & Zhu, 2016 STE Ozone flux:shifting from west - south - east
I: West wind Tagged ozone from each source regions
II: South wind Tagged ozone from each source regions
III: Eest wind Tagged ozone from each source regions
Time series of tagged ozone from each source regions to Nanjing at different height lateral
Conclusions and remarks Tracer-tagged methods were implemented into MOZART and WRF-Chem for better understanding on ozone contribution from source regions. In comparison with large-scale research in global models,regional-scale O3 source apportionment requires not only tagging ozone itself, but also tracking its precursors (NOx and VOCs). Uncertainties still exist in ozone source apportionment methods due to an incomplete tracing of the species in our studies .
YRD local Near-Windy Jan 2015:Online PM2.5 tracing regions-tagging in YRD LRT-North Kang&Zhu 2015, submitted to JGR 15