Download
1 / 11
110 likes | 232 Views
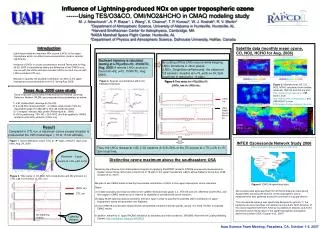
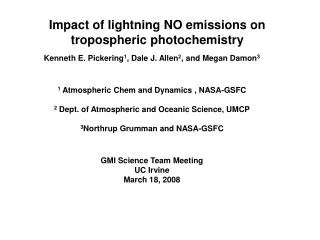
Estimating the Influence of Lightning on Upper Tropospheric Ozone Using NLDN Lightning Data. Lihua Wang/UAH Mike Newchurch/UAH Arastoo Biazar/UAH William Koshak/NASA. 3rd Annual GOES-R GLM Science Meeting, December 1-3, 2010

E N D
Estimating the Influence of Lightning on Upper Tropospheric Ozone Using NLDN Lightning Data Lihua Wang/UAH Mike Newchurch/UAH Arastoo Biazar/UAH William Koshak/NASA 3rd Annual GOES-R GLM Science Meeting, December 1-3, 2010 National Space Science & Technology Center, 320 Sparkman Drive, Huntsville, AL
CMAQ • 7/15~9/7/2006 • U.S. Continent • Meteorology: MM5 • Emission: SMOKE • LNOx: NLDN observation • Evaluation: IONS06 ozonesonde, OMI O3/NO2
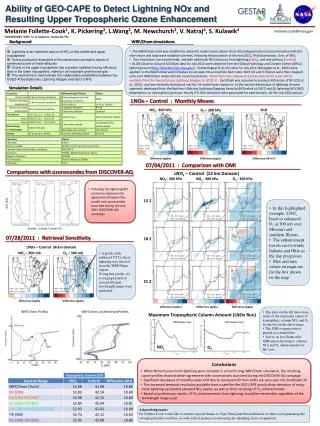
LNOx Parameterization • Adjust CG flash counts for NLDN detection efficiency of ~95% • Scale up the CG flash counts to total flashes assuming IC:CGratio is 3, which is close to the Boccippio et al. (2001) 4-yr mean IC:CG ratio value (2.94). • Estimate the total quantity of lightning-produced N mass assuming a 500 moles (~ 3.011x1026 molecules) N per CG/IC flash production rate. • Vertically-distribute onto 39 model layers following the mid-latitude continental LNOx distribution profiles Pickering et al. [1998] developed. • Add LNOx emission to SMOKE estimated NOx emissions. • LNOx emission accounts for 27% total NOx emission averaged over the entire model domain, and 37.9% (SW), 32.1% (SE), 16.6% (NE), and 15.6% (NW) for the four sub-regions, respectively. • -------- • Make a CMAQ run including LNOx (CNTRL_LNOx) Figure 1 - Total CG flashes (7/15-9/7/2006) observed by NLDN 3
Results: Model NO2 Prediction versus OMI NO2 (7/30/2006) OMI total NO2 OMI trop. NO2 CNTRL_LNOx trop. NO2 CNTRL trop. NO2 CNTRL trop. NOx CNTRL_LNOx trop. NOx Figure 2 - NO2 column from OMI retrieval and CMAQ model prediction. The CMAQ tropospheric NO2 is calculated based on the tropopause pressure from OMI ozone data. 4
Results:Model O3 Prediction versus OMI O3 (trop. column) CNTRL CNTRL_LNOx OMI 7/30/2006 8/10/2006 5 Figure 3 – Model-predicted tropospheric ozone column at 19:00 GMT of (upper) July 30, 2006 and (bottom) August 10, 2006, compared with OMI tropospheric ozone retrieval.
Bratt’s Lake Kelowna Egbert Paradox Yarmouth Valparaiso Trinidad Head Boulder Narragansett Walsingham Beltsville Wallops Island Socorro Huntsville Table Mountain Holtville Houston Research vessel Ron Brown Results: Evaluation with ozonesondes (continued) Figure 4 - LNOx-influenced ozone at IONS06 stations. Not influenced: Kelowna(26), Bratt’s Lake(28), Trinidad Head(29) Improved: Table Mountain(25), Holtsville(10), Boulder(27), Egbert(15), Paradox(5), Yarmouth(13), Walsingham(19), Narragansett(27) Significantly improved: Socorro(25), Houston(16), Ron Brown(23), Huntsville(29), Valparaiso(5), Beltsville(9), Wallops Island(10) Note: Digits indicate numbers of coincidence pairs between ozonesonde measurements and model prediction. 6
Results: Evaluation with ozonesondes Huntsville Significantly improved Kelowna (not influenced) Egbert (slightly improved) Overall influence (252 sample pairs) Figure 5 - Mean normalized bias of model predicted ozone (CNTRL and CNTRL_LNOx runs) and OMI O3, evaluated by ozonesondes at three sites: Kelowna, Egbert and Huntsville, representing three kinds of lightning influence: not influenced, improved and significantly improved, respectively. The last panel gives the overall influence at these 18 sites. 7
Figure 7 – Mean of 29 ozonesondes measured between 17:00 ~19:00 GMT during August 2006, as well as mean of model predictions (CNTRL and CNTRL_LNOx) at 19:00 GMT. 18 ppbv enhancement due to lightning Figure 6 - Model predictions of ozone concentration at Huntsville, AL during August 2006, with 29 ozonesonde profiles (interpolated onto CMAQ vertical resolution) overplotted. Top: CNTRL; Bottom: CNTRL_LNOx A case study in Huntsville, AL during August 2006 shows increased NOx in upper troposphere due to lightning-NOx injection, and finds corresponding ozone enhancement around same altitude (~10 km), but still 20 ppbv lower than ozonesonde measurement O3 NO2 NO 8 Figure 8 – Differences in NO, NO2 and O3 between CNTRL_LNOx and CNTRL for Huntsville, AL during August 2006, due to lightning influence.
Consistent with Cooper et al., 2009 Figure 9 - Left: Monthly average location of a 20-day passive LNOx tracer that has been allowed to decay with a 4-day e-folding lifetime, indicating the regions where LNOx would most likely be found, as well as the regions where ozone production would most likely occur, for July through September 2006 [Cooper et al., 2009]. Right: Median filtered tropospheric ozone (FTO3) mixing ratios during August 2006 at all 14 IONS06 measurement sites between 10 and 11 km. FTO3 is the measured ozone within the troposphere with the model calculated stratospheric ozone contribution removed [Cooper et al., 2007]. 9
DC3 in 2012 • May ~ June 2012 • NCAR HIAPER aircraft and the NASA DC8 • the most extensive set of upper tropospheric trace gas measurements ever obtained above the south-central United States, with a focus on thunderstorm outflow. • DC3 provides an excellent opportunity to correct the deficiencies in chemical transport models regarding LNOx production, ozone/NOx lifetime and ozone production rates in the upper troposphere.
Huntsville, AL in DC3 • Huntsville, Alabama is identified as an ideal location to monitor the build-up and decay of the UTOM due to its location at or near the center of the UTOM [Cooper, et al., 2006; Cooper, et al., 2007; Cooper, et al., 2009]. • The ozone lidar will be the primary instrument as it is more cost effective. • Near-daily tropospheric ozone profiles over a 16-week period from June 1 through September 21, 2012 • WRF-CHEM chemical transport model at fine resolution (12 km) over the continental United States: • (1) In situ trace gas measurements from the NCAR and NASA aircraft to constrain LNOx production rates and ozone/NOx lifetimes in the upper troposphere. • (2) to quantify the sources of the UTOM during June-September 2012.