Download
1 / 24
250 likes | 383 Views
Impact of surface ozone on agricultural crop yield reductions and economic damage in India under present emission scenario Sachin D. Ghude Chinmay Jena, D.M.Chate G. Beig G. Pfister V. Ramanathan Indian Institute of Tropical Meteorology (IITM)

E N D
Impact of surface ozone on agricultural crop yield reductions and economic damage in India under present emission scenario Sachin D. Ghude Chinmay Jena, D.M.Chate G. Beig G. Pfister V. Ramanathan Indian Institute of Tropical Meteorology (IITM) National Center for Atmospheric Research (NCAR) Scripps Institute of Oceanography, UCSD, San Diego
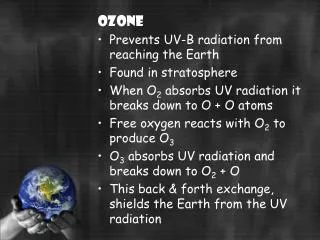
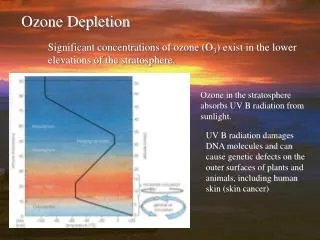
Tropospheric ozone Ozone (O3) is a highly reactive gas. Main Drivers Formed primarily from photochemical reactions between two major classes of air pollutants, volatile organic compounds (VOC) and nitrogen oxides (NOx).
What do we know about ozone Impact on vegetation and ecosystem? • Damage to leaf injure • Growth and yield reduction • Reduce carbon uptake by metabolizing less CO2 (indirect global Warming) • Reduces carbon flow from atmosphere to roots and reduces nitrogen fixation in soil (nitrogen runoff) • Reduce canopy evapotraspiration and soil water depletion and may increase sensible heat near the surface Fluorescence imaging: soybean plant responses to elevated levels of ozone (From Kim, et al., 2001). Adams et al., 1989, adapted by Chameides et al., 1999
Agriculture is broadest economic sector, plays a significant role in socio-economic fabric. • With only 2.3% share in world’s total land area, India has to ensure Food security of its 1.2 billion population. • National Food Security Bill. • Ensure availability of sufficient food grains for domestics demand and • access to adequate quantity of subsidies food for 820 million people Ghude et al., J. Atm. Chem, 2009, Ghude et al., JGR, 2013
General outline of the different steps involved in the data analysis for estimate crop production loss Meteor- ology Emission Dist wise Crop production WRF-Chem (Hourly ozone) Dist wise sowing dates Grided (CP) Crop production AOT40 RYL (a*AOT40) Grided Crop production loss (CPL) Total Loss (sum CPL) Economic loss Soybeans Cotton Wheat Rice (a=0.0113) (a=0.0151) (a=0.163) (a=0.0445) Mills et al. 2007, corrected AOT40 for offset CPL=RYL/(1-RYL) x CP Dingenen et al., 2009
WRF-Chem Simulation for Year 2005 Domain : South Asia (0 - 45° N, 55 -110 ° E) Period : One Year ( 2005, Hourly simulations) Resolution : 55 km x 55 km Meteorology : NCAR NCEP/FNL Gas Ph. Chem : MOZART Aero Ph. Chem : GOCART Boundary Cond. : MOZART-4 (updated every 6-h) Photolysis :Madronich F-TUV Emissions : INTEX-B (A Priori) (For NOx our top down) Fire Emission : NCAR Fire Inventory (FINN) (plume rise) Biogenic : MEGAN (online)
Comparison between observed and simulated NOx over India for different emission estimate and respective surface ozone distribution (for Jan-2005)
General outline of the different steps involved in the data analysis for estimate crop production loss Meteor- ology Emission Dist wise Crop production WRF-Chem (Hourly ozone) Dist wise sowing dates Grided (CP) Crop production AOT40 RYL (a*AOT40) Grided Crop production loss (CPL) Total Loss (sum CPL) Economic loss Soybeans Cotton Wheat Rice (a=0.0113) (a=0.0151) (a=0.163) (a=0.0445) Mills et al. 2007, corrected AOT40 for offset CPL=RYL/(1-RYL) x CP Dingenen et al., 2009
Crop Yield for various crops during 2005 Source: Special data dissemination standard-Directorate of economics and statistics (SDDS-DES), Ministry of Agriculture, Government of India.
General outline of the different steps involved in the data analysis for estimate crop production loss Meteor- ology Emission Dist wise Crop production WRF-Chem (Hourly ozone) Dist wise sowing dates Grided (CP) Crop production AOT40 RYL (a*AOT40) Grided Crop production loss (CPL) Total Loss (sum CPL) Economic loss Soybeans Cotton Wheat Rice (a=0.0113) (a=0.0151) (a=0.163) (a=0.0445) Mills et al. 2007, corrected AOT40 for offset CPL=RYL/(1-RYL) x CP Dingenen et al., 2009
Simulated daytime (> 50 W/m2 global radiation ) mean surface ozone concentration Kharif (Cotton, Rice & Soybeans) Rabi (Wheat & Rice)
Wheat production and loss (Rabi) during 2005 Production : 71 MT Loss : 3.5 (± 0.8) MT
Rice production and loss (Kharif + Rabi) during 2005 Production : 95.1 MT Loss : 2.1 ( ± 0.8) MT
Soyabean and cotton production and loss (Kharif) during 2005 Production : 8.6 MT Loss : 0.23 (± 0.16) MT Production : 3.3 MT Loss:0.17 (±0.10) MT
Aggregated reduction for top ten wheat and rice producing sates in India Wheat loss is greatest in Maharashtra (17%) Rice loss grates in Punjab (8%) Punjab and Haryana (< 1%)
Wheat Rice Impact of 100% cuts in anthropogenic NOX and VOCs emissions 100% VOcs cuts results in 28% decrease (1.7 MT saved) 100% NOx cuts results in 93% decrease (98% for rice and 90% for wheat) (5.2 MT saved)
Estimated Economic Loss (year 2005) due to ozone damage Total Economic Loss : 1.29 (± 0.47)billion USD2005
Conclusion: • Nationally aggregated relative yield loss of wheat, Rice, Cotton and Soybeans due to high O3 exposure totals 5.6 million tons amounting ~1.3 billion USD2005 Economic loss. • This loss is about double the about of wheat exported yearly or 50% of the rice exported annually. • The estimated economic loss due O3 induced yield loss alone in India is half of the estimated economic loss due to crop globally caused by global warming. • Loss of 5.6 million tons of wheat and rice could have fed 94 million beneficiary under the provision of national food security bill. • NOx emission cut could effectively mitigate ozone-induced production losses and significantly crop production output.
Tropospheric ozone Ozone (O3) is a highly reactive gas. Main Drivers is formed primarily from photochemical reactions between two major classes of air pollutants, volatile organic compounds (VOC) and nitrogen oxides (NOx) Many people mistakenly believe that tropospheric ozone concentrations are high only in major urban areas. It is also formed in smaller cities it is transported hundreds of miles downwind from where it is created to affect ambient air quality in other urban and rural areas
Studies in open-top field chambers have repeatedly verified that flecking,stippling, bronzing and reddening on plant leaves are classical responses to ambient levels of ozone. Plants grown in chambers receiving air filtered with activated charcoal to reduce ozone concentrations do not develop symptoms that occur on plants grown in nonfiltered air at ambient ozone concentrations. Foliar symptoms shown on this web site mainly occurred on plants exposed to ambient concentrations of ozone
ozone exposure indices Seasonal daytime mean for 7 hours (M7) Seasonal daytime mean for 12 hours (M12) Accumulated daytime ozone concentration above a threshold of 40 ppbv AOT 40 (Accumulation exposure over threshold of 40 ppb) is an exposure-plant response index function set by the United Nations Economic Commission for Europe (UN-ECE) and US-EPA. It is calculated as the sum of differences between the hourly averaged O3 concentration and the threshold value of 40 ppb for each hour (radiation > 50 W m-2) that the averaged O3 concentration exceeds 40 ppb. n AOT 40 = ([O3] – 40)i for [O3] > 40 ppb i=1
Monthly AOT40 at Pune and Delhi AOT40 values for the mean period (2003-2006) At Pune Ghude et al., J. Atm. Chem, 2009 Beig, Ghude, et al., GRL, 2008