Download

1 / 54
540 likes | 603 Views
The IEM-KCCI-NWS Partnership: Working Together to Save Lives and Increase Weather Data Distribution. PROJECT REVIEW. KCCI-TV INSTALLED 45 SCHOOLNET WEATHER STATIONS BEGINNING DECEMBER OF 2000 TO PRESENT EACH STATION REPORTS CONTINOUSLY VIA THE INTERNET.

E N D
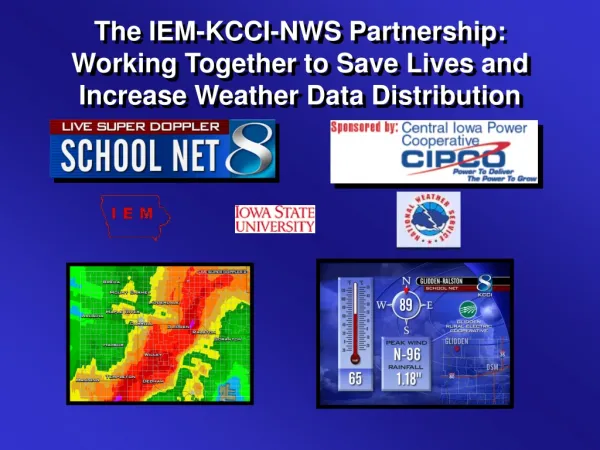
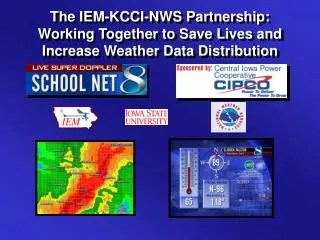
The IEM-KCCI-NWS Partnership: Working Together to Save Lives and Increase Weather Data Distribution
PROJECT REVIEW • KCCI-TV INSTALLED 45 SCHOOLNET WEATHER STATIONS BEGINNING DECEMBER OF 2000 TO PRESENT • EACH STATION REPORTS CONTINOUSLY VIA THE INTERNET. • GENERATING MORE THAN 500,000 INTERNET PAGE VIEWS EACH MONTH • INCREASED KCCI-TV IDENTITY IN RURAL COMMUNITIES.
Now What? • Too Much Data too watch at once! • Have to relay information to NWS via radio. • Daily notification of schools for outages. • Then along came the Iowa Environmental Mesonet
Iowa Environmental Mesonet • Gather, collect, compare, disseminate and archive Iowa data. • Currently gathering data from 9 networks, including KCCI’s • Archive holds over 250 million observations made in the state.
SchoolNet value added data • Real Time data processing • Monitor for 50+ MPH gusts and measurable rainfall • Implement a 1 minute wind averaging scheme • Calculate rainfall accumulations
IEM Data Services • Archive EVERY observation • Convert ASCII data feed into METAR and other formats • Build unique web applications • Quality Control
Data storage • NEXRAD Radar 100 MB/day (9 sites) • Products/plots 2 MB/day • GEMPAK surface data 8 MB/day • Raw surface data 12 MB/day • Daily Total 122 MB/day
Improved NWS Data, Service and Education IEM NWS KCCI - TV
GISClimatology Snowfall Rainfall Temperature Wind Severe Weather Flooding Climate Atlas
GIS in Warning Decisions GIS Data used by warning meteorologists • Detailed road networks • Urban area mapping • Detailed rivers and basin data In the future • Significant landmarks • Polygon warnings
GIS in Hydrology • Precipitation Analysis • Local flood modeling • Basin Delineation • Hydro-climatology • AHPS mapping
Future NWS Projects • All hazards climatology for Iowa • Basin Customization • Developing improved Flash Flood Guidance
IEM GIS Efforts • Why? • ‘Traditional’ WWW is good, but not the answer. • How? • OpenSource software, open standards, OpenGIS. • When? • Needs to be done yesterday.
IEM GIS Thrusts • Web-mapping with MapServer • WMS client/server, WFS client/server • Spatial Database storage with PostGIS • Support geographic objects in PostgreSQL • Formatting spatial data formats • Shapefile, netCDF, Georeferenced Images • GIS Education
#1: Spatial Precip Viewer • NEXRAD Storm Total (STP) and one hour precip (N1P) products are gridded, plotted and geo-referenced. • Surface precip observations are ingested and placed in the spatial database. • Great way to qualitatively compare NEXRAD estimates with “ground-truth”
#2: Iowa Tornado Database • The tornado database was the first step in putting together an “All Hazards” database for Iowa. • Compiled by Chris Anderson at ISU • Entries are placed in a spatial database and queried out by MapServer. • We look to expand the meta-data held in this system. (News clippings, stories…)
#3: NWS Warnings with National RADAR • Geo-reference a national RADAR mosaic • Wrote a text to spatial database decoder for the SVR and TOR products. Polygon and county based warnings are saved. • Combine these data sources with MapServer
#4: 3-4 June 2002 Flooding • Heavy rainfall event in Eastern Iowa. Localized flooding. • Geo-referenced NEXRAD Storm Totals. • Included surface observations • Used by Iowa Emergency managers as a baseline to identify locations that may have experienced flooding.
#5 PHP MapScript Example • Dynamically generate a variable plot based on user selected stations.