Download
1 / 28
280 likes | 387 Views
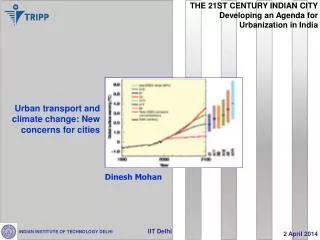
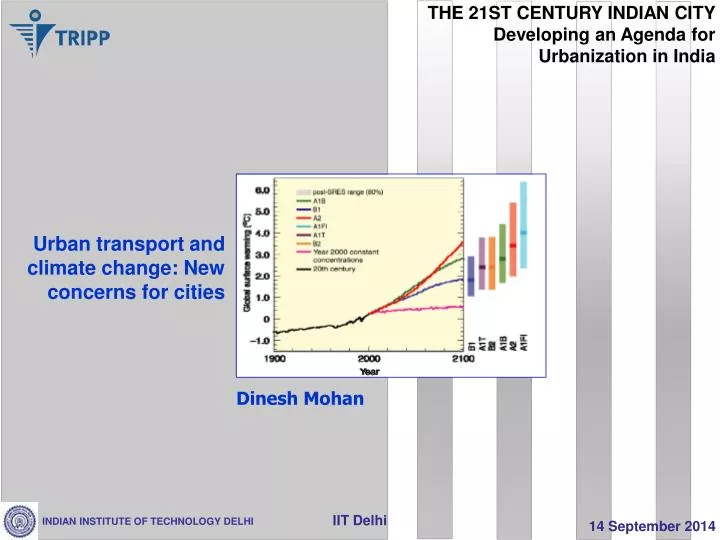
THE 21ST CENTURY INDIAN CITY Developing an Agenda for Urbanization in India. INDIAN INSTITUTE OF TECHNOLOGY DELHI. Urban transport and climate change: New concerns for cities. Dinesh Mohan. Urban transport – changing concerns. 1990s- Pollution

E N D
THE 21ST CENTURY INDIAN CITY Developing an Agenda for Urbanization in India INDIAN INSTITUTE OF TECHNOLOGY DELHI Urban transport and climate change: New concerns for cities Dinesh Mohan IIT Delhi
Urban transport – changing concerns • 1990s- Pollution • 2000s- Road Safety (concern but unscientific) • Late 2000s- Lip service to climate change IIT Delhi
India rich India middle class 2050 India poor Poor have to increase energy consumption IIT Delhi Rich and middle class must reduce energy consumption
City density – traditional understanding IIT Delhi
Car use and density redone Source: MEES, P. (2010) Density and sustainable transport in US, Canadian and Australian cities: another look at the data, World Council Transportation Research, Lisbon, Proceedings 12th WCTR. IIT Delhi
Density, cities > 10 million Asia/Africa Europe/USA IIT Delhi
Density, cities ~ 5 million Asia/Africa Europe/USA IIT Delhi
The Indian City: 18th -21st Century Present city Indian high density city – pre 1850 Colonial city – 1850-1950 IIT Delhi September 14
Vehicle ownership in countries with per capita incomes US$ 1,500-8,000 India 2030 IIT Delhi
Regional car segment share in 2015 Smallest India Largest, SUV Europe USA IIT Delhi
Pre-conditions for clean air • Shorter trips • Mixed land use • Negative feedback for long trips – • Fares based on distance • Transport speeds around 15-20 km/h • Use of less polluting modes • walking, cycling >> safety essential • Use of public transport • Close to home and work – dense network • Minimum infrastructure • Lowest emissions for vehicles IIT Delhi
DELHI IIT Delhi
CO2 emission estimates for Taipei Metro D Bus Rapid Transit Source: Prof Jason Chang IIT Delhi 2008
Life cycle emissions – rail modes Source: Mikhail Chester and Arpad Horvath 2008 Environmental Life-cycle Assessment of Passenger Transportation: A Detailed Methodology for Energy, Greenhouse Gas, and Criteria Pollutant Inventories of Automobiles, Buses, Light Rail, Heavy Rail and Air. WORKING PAPER, UCB-ITS-VWP-2008-2, University of California, Berkeley.
Life cycle emissions – road modes Source: Mikhail Chester and Arpad Horvath 2008 Environmental Life-cycle Assessment of Passenger Transportation: A Detailed Methodology for Energy, Greenhouse Gas, and Criteria Pollutant Inventories of Automobiles, Buses, Light Rail, Heavy Rail and Air. WORKING PAPER, UCB-ITS-VWP-2008-2, University of California, Berkeley.
Estimates CO2 emissions per passenger in Delhi • Calculations based on: • Passengers carried per day (metro system and per bus) • Energy consumed (Total electricity bill for Metro and diesel consumed per bus • CO2 emitted per MVAH at the powerhouse, well-to-wheel CO2 for diesel • Fly ash emitted by metro system not included IIT Delhi September 14
Delhi Metro Ridership IIT Delhi
DOOR TO DOOR TRIP TIMES ELEVATED/ UNDERGRND PT SURFACE PT CAR BICYCLE WALK ELEVATED UNDERGRND PT SURFACE PT CAR BICYCLE 3 KM 6 KM CAR SURFACE PT ELEVATED UNDERGRND/ PT SURFACE PT ELEVATED UNDERGRND PT CAR 12 KM 24 KM IIT Delhi 2011
ISSUES • Even cities in high income countries have not been able to solve the problems that all of us have to deal with in the near future NO INDIAN CITY HAS CAR USE MORE THAN 15% IIT Delhi September 14
Expenditure in Rs - 6 km round trip per day for 1 month Marginal cost Minimum family income in Rs per month: Bus use – 6,000 Metro - 9,000 Motorcycle - 30,000 Car - 60,000 20-30% families earn less than Rs. 5,000 per month 70% families earn less than Rs 35,000 per month IIT Delhi September 14
CO2 and roads “One-way streets reflect the dominance of the car and the failed go-faster policies of the traffic engineers. As we begin to realise that walking and cycling should be the dominant forms of transport, the one-way street should be consigned to the dustbin of history.” Peter Murray, Head of the New London Architecture Centre, 20th CENTURY SOLUTIONS: • One way streets? • Road widening & expansion? • Flyovers, elevated/underground corridors? • Metro/LRT/Monorail/Skybus - providing corridor capacity to serve link demand • Underground trains seen as a major solution during cold war as nuclear shelters • Surface transport less energy consumimng • Underground or elevated transit does not reduce congestion, provides extra supply > CO2 • CO2 ≈ road area + distance of travel Solutions contractor driven Not people driven IIT Delhi 2011
A typical brick shelter found on a Valley Lines railway station in South Wales U.K. (left) and a redesigned transparent shelter (right) (Source: Cozens, 2004) 33 per cent increase in annual passenger flows IIT Delhi 2009
Latest evidence Possibilities to reduce CO2 emissions from road traffic for urban planners seem limited: a restriction of space dedicated to traffic and a change of transport means for commuting represent leverage points. Reckien,D., Ewald,M., Edenhofer,O., & Ludeke,M.K.B. (2007). What Parameters Influence the Spatial Variations in CO2 Emissions from Road Traffic in Berlin? Implications for Urban Planning to Reduce Anthropogenic CO2 Emissions. Urban Studies, 44(2), 339-355. The results suggest that public transport users could achieve dramatic savings on their commute if the density of that network was increased considerably Murphy,E. (2009). Excess commuting and modal choice. Transportation Research Part A: Policy and Practice, 43(8), 735-743. Current urban policy, which relies predominantly on ambitious and expensive programmes of transport infrastructure provision must be rethought in Beijing ZHAO, P., LU, B. & LINDEN, G. J. J. (2009) The effects of transport accessibility and jobs and housing balance on commuting time: evidence from beijing. International planning studies, 14, (1) 65-83. High speed systems will further encourage sprawl and greater energy consumption, and hence, Public Transit (PT), even if the commercial speed is rather low, is probably the only way to improve urban accessibility and urban attractiveness in a sustainable way CROZET, Y. Economic development and the role of travel time: the key concept of accessibility, Gothenberg: Volvo Research & Educational Foundations, pp. 1-22. IIT Delhi 2011
Indian cities • Modal shares • 30-50% Pedestrians • 10-20% Bicycles • ~ 30% formal/informal “public” transport • 10-20% Motorcycles • 5-10% cars (Delhi ~ 15%) • Cannot afford very expensive transit systems: • Subsidy in Delhi – Rs 35,000/passenger per year • Motorcycles: Rs 1 per km marginal cost – keeps public transport fares low, need minimum infrastructure cost to minimise subsidy • ~ 80% employment in informal sector IIT Delhi
Safe roads a precondition for the future low CO2 city • Children, elderly, walking speed ~ 0.8 m/s • Pedestrian green phase < 30 s • Therefore, motorised lanes < (30 X 0.8) = < 24 m • Shops and/or street vendors by design • City blocks ~ 800 m square • Maintain urban average speeds at 15 km/h • Public transit on surface IIT Delhi