Download
1 / 23
230 likes | 315 Views
Directorate-General for E nergy and Transport. EUROPEAN COMMISSION. Urban Transport Trends in Participant Cities. Neil Taylor Transport & Travel Research Ltd. Introduction. Background Data collected Key findings EU enlargement context

E N D
Directorate-General for Energyand Transport EUROPEANCOMMISSION Urban Transport Trends in Participant Cities Neil Taylor Transport & Travel Research Ltd
Introduction • Background • Data collected • Key findings • EU enlargement context • Examples from Southern Europe • New Member State trends • Key Challenges • Ideas for NMS cities
Background • First defined in 2003, now in 3rd evolution • Common indicators → quantitative data. • Data gathered in yr3 similar to yr 2 • Effective baseline dataset now created • Aim of yr 3 analysis = delve deeper
Data Collected – Common Indicators 1.1 Area of region 1.2 Area of city 1.3 Population of region 1.4 Population of city 1.5 Geography 2.1: Fixed routes 2.2: Flexible routes 2.3: Public transport priority 2.4: Cycling space in the city 3.1 Car ownership 3.2 Public transport fleet 3.3 PT Accessibility 3.4 Clean Vehicles 4.1 Average speed (private transport) 4.2 Average speed (public transport) 4.3 Service intervals 4.4 Modal split 4.5 Total passengers carried 4.6 Farebox revenue 5.1 Cost of car use 5.2 Cost of public transport 5.3 Investment in public transport 5.4 Investment in roads 5.5 Gross Domestic Product 5.6 Employment 6.1 Traffic accidents
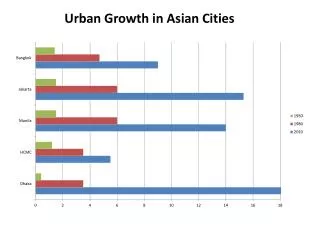
Key Findings • Higher GDP per capita → Higher Car modal share and lower PT modal share • Urban metro systems most extensive in bigger cities. Approx. threshold = 40-45km of metro per 1million population. • Metros encourage significantly greater PT use in cities.
Common Indicators – Reporting • Detailed findings and trends in final report • Due to be published end summer 2006 • Also identified trends in New Member State (NMS) & Accession Country cities
NMS/Accession Country Cities • 7 cities from NMS/Accession Countries involved • Suceava • Bucharest • Budapest • Gdansk • Warsaw • Prague • Sofia • Since we are in Budapest today… • … It seems appropriate to look at some of the NMS/Accession city trends!
EU Enlargement - context • EU Enlargement in 2004 • Slovenia to enter Eurozone Jan 1st 2007 • Rapid economic growth expected… • Inward investment triggering growth • Pressure for transport links • Expected increase in disposable incomes? • Increase in car ownership?
Comparison with Southern Europe • Athens, Lisbon, Alicante, Palma, Barcelona & Madrid • In states which joined EU in 1981 and 1986 • Rapid economic growth followed accession • Large increases in car ownership & use (Lisbon) • Unplanned urban development (e.g. Athens) • Current policies seek to resolve problems of rapid growth. • Could NMS cities learn from these experiences?
NMS/EU15 city comparisons - 1 • NMS cities generally demonstrate high levels of public transport modal share (> 50%) • The real cost of PT can be greater in NMS cities than in EU15 cities • Car ownership levels are generally lower in NMS cities. • BUT: Vast differences also exist between NMS cities • Prague’s economy relatively strong (> EU15 avg. GDP per Capita)
NMS/EU15 city comparisons - 2 • Clean Vehicles less apparent in NMS cities’ bus fleets → trickle down of technology? • Public transport often inaccessible for people with reduced mobility (0.3% to 30% of bus fleets) • Trolley buses and first generation tram systems are most predominant in NMS cities • Significantly less road-space in NMS cities – Prague the exception
Key Challenges • Funding Issues • Who will fund transport provision in NMS cities? • Affordability of clean/accessible vehicle fleets • Involvement in these benchmarking projects • Investment Pressure • Will FDI drive the NMS cities’ urban transport agenda? • Increased road/motorway capacity a priority for investors? • Links to EU15 rather than other NMS cities? • Possible need for socially inclusive approach to managing growth
Ideas for NMS Cities • Pre-emptive land-use & transport planning • Spread investment beyond growth poles • Maintain a quality public transport alternative • Apply EU15 good practice examples in NMS cities • Careful use of restrictive measures: • Balance the need to attract FDI with development control
Thank you for listening… Project Contacts: E-mail: benchmarking@ttr-ltd.com Web: www.transportbenchmarks.org Tel: +44 (0) 1543 416416 Kieran Holmes, Sarah Clifford, Neil Taylor, Ben Smith