Download
1 / 30
300 likes | 471 Views
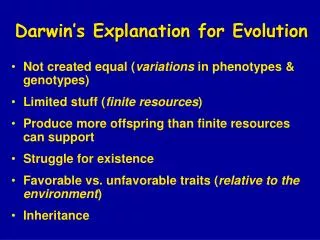
Your Marks An explanation for TEE students. Your Marks An explanation for TEE students. TEE Mark. These are the marks you get on your Statement of Results. Scaled Mark. School Mark. Your Marks An explanation for TEE students. TEE Mark. Standardised. This slide, and the next four,

E N D
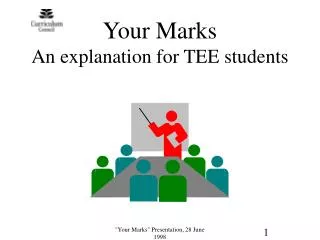
Your MarksAn explanation for TEE students "Your Marks" Presentation, 28 June 1998
Your MarksAn explanation for TEE students TEE Mark These are the marks you get on your Statement of Results Scaled Mark School Mark "Your Marks" Presentation, 28 June 1998
Your MarksAn explanation for TEE students TEE Mark Standardised This slide, and the next four, show the processes used to adjust marks. Scaled Mark School Mark "Your Marks" Presentation, 28 June 1998
Your MarksAn explanation for TEE students TEE Mark Standardised Scaled Mark School Mark Moderated "Your Marks" Presentation, 28 June 1998
Your MarksAn explanation for TEE students TEE Mark Standardised Scaled Mark School Mark Moderated Standardised "Your Marks" Presentation, 28 June 1998
Your MarksAn explanation for TEE students TEE Mark Standardised 50% Combined Mark Scaled Mark 50% School Mark Moderated Standardised "Your Marks" Presentation, 28 June 1998
Your MarksAn explanation for TEE students “Scaling” refers to this final step, not the whole sequence. TEE Mark Standardised 50% Combined Mark Scaled Mark 50% School Mark Moderated Standardised "Your Marks" Presentation, 28 June 1998
Entry to University is competitive. We make the competition as fair as possible. "Your Marks" Presentation, 28 June 1998
Why Standardise? A level playing field? "Your Marks" Presentation, 28 June 1998
Within a given subject, TEE papers vary in difficulty from year to year. In a year when the paper was harder than usual, marks would be lower than usual. Standardisation ensures that students whose papers are harder than usual are not disadvantaged. "Your Marks" Presentation, 28 June 1998
Why Standardise?The information below comes from the results of the 1997 TEE AVERAGE MARKS Raw TEE Subject A 65 Subject B 53 In Subject A, students found it easier to get marks than in Subject B. "Your Marks" Presentation, 28 June 1998
Why Standardise?The information below comes from the results of the 1997 TEE Raw TEE marks are standardised to the same distribution, in every subject. AVERAGE MARKS Raw TEE Std. TEE Subject A 65 58 Subject B 53 58 Standardising ensures that students who took the easier exam are not advantaged "Your Marks" Presentation, 28 June 1998
As a general rule, if a TEE paper is harder than usual standardising will adjust the marks upwards. If a TEE paper is easier than usual, standardising will adjust marks downwards. The next slide shows the effect of standardisation on the 1997 English TEE marks. This paper was harder than usual. "Your Marks" Presentation, 28 June 1998
Effect of StandardisationEnglish TEE, 1997 "Your Marks" Presentation, 28 June 1998
Why Moderate? Students taking the same subject in different schools are assessed with different tests and exams. Moderation ensures that no student is unfairly disadvantaged by hard tests and exams. "Your Marks" Presentation, 28 June 1998
Why Moderate?The information below relates to the Year 12 Chemistry results of two schools in 1997. It looks as if students in School B are 10 marks better than those in School A. Are they really? Or are easier tests and exams in School B just making them appear better? Average School Mark School A 65 School B 75 "Your Marks" Presentation, 28 June 1998
Higher marks could be due to the use of easier tests and exams. But alternatively, the students with higher marks might really have achieved more. One way to settle the question is to give both groups of students the same exam. If one group really is better, this should be apparent in the results in a common exam. The TEE is a common exam for both groups of students. "Your Marks" Presentation, 28 June 1998
Why Moderate?The information below relates to the Year 12 Chemistry results of two schools in 1997. Average Average School Standardised MarkTEE School A 65 65 School B 75 65 It can now be seen that the two groups of students are of equal ability, on average. "Your Marks" Presentation, 28 June 1998
Why Moderate?The information below relates to the Year 12 Chemistry results of two schools in 1997. Average Average Average School Standardised Effect of Mark TEEModeration School A 65 65 0 School B 75 65 -10 "Your Marks" Presentation, 28 June 1998
In the previous example, the school marks (not the TEE marks) of students in School B are adjusted down by 10 marks, on average. School marks of students in School A are on the same scale as their standardised TEE; they need no adjustment. Moderation also involves adjusting the spread of school marks so that they match the distribution of students’ standardised TEE marks. Standardised TEE marks are the common scale onto which school marks are adjusted. "Your Marks" Presentation, 28 June 1998
Why Scale? If the athlete clears the higher bar (left) he is more successful. However, the risk of failure is less if he attempts the lower bar (right). How should he decide which goal to attempt? "Your Marks" Presentation, 28 June 1998
It might be thought that students choosing TEE subjects face the same dilemma as the high jumper. Should they choose hard subjects and risk failure, or is it better to play safe by choosing easy subjects? The scaling procedure eliminates this problem and is designed to treat students fairly, whether they choose easy or difficult subjects. "Your Marks" Presentation, 28 June 1998
Why Scale? If marks were not scaled, students would be disadvantaged by choosing challenging subjects. In principle, if other factors can be ignored, a student of a given ability should get the same scaled mark whatever subject he/she decides to take. "Your Marks" Presentation, 28 June 1998
AVERAGE MARKS SCALING (AMS) • AMS calculates a scaling graph for each subject, using only the results of students in the scaling population in the current year. • After scaling, the ranking of students is the same as before. • Subjects in which the average ability of students is high tend to be scaled up. "Your Marks" Presentation, 28 June 1998
AMS Scaling Population The scaling graphs are based on the results of all students with FOUR or more combined marks, not counting the results of background candidates in French, German and Italian. After the scaling graphs have been constructed, they are used to scale ALL students’ combined marks. This includes students who are not in the scaling population. "Your Marks" Presentation, 28 June 1998
100 90 80 70 60 50 40 30 20 10 0 0 10 20 30 40 50 60 70 80 90 100 A Scaling Graph This graph relates combined marks to scaled marks. Scaled Marks Combined Marks "Your Marks" Presentation, 28 June 1998
100 90 80 70 60 50 40 30 20 10 0 0 10 20 30 40 50 60 70 80 90 100 A Scaling Graph For example, let us scale a combined mark of 65. Scaled Marks Combined Marks "Your Marks" Presentation, 28 June 1998
100 90 80 70 60 50 40 30 20 10 0 0 10 20 30 40 50 60 70 80 90 100 A Scaling Graph In this example, a scaled mark of 69 is obtained. Scaled Marks Combined Marks "Your Marks" Presentation, 28 June 1998
Your MarksAn explanation for TEE students TEE Mark Standardised How all the processes fit together. 50% Combined Mark Scaled Mark 50% School Mark Moderated Standardised "Your Marks" Presentation, 28 June 1998
THE END "Your Marks" Presentation, 28 June 1998