Download
1 / 28
280 likes | 285 Views
This module explores life tables, survivorship curves, and life history traits in populations. It also discusses the impact of predation on life history traits and the concept of r-selection and K-selection. Additionally, it examines the exponential growth of the human population and its ecological footprint. The module concludes by discussing the demographic transition and the practical applications of population ecology.

E N D
CHAPTER 35Population Dynamics Modules 35.6 – 35.10
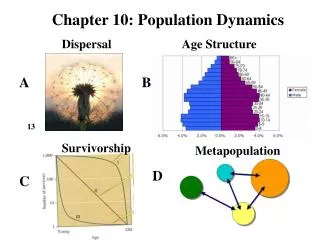
LIFE HISTORIES AND THEIR EVOLUTION 35.6 Life tables track mortality and survivorship in populations • Life tables and survivorship curves predict an individual's statistical chance of dying or surviving during each interval in its life • Life tables predict how long, on average, an individual of a given age can expect to live
This table was compiled using 1995 data from the U.S. Centers for Disease Control Table 35.6
Population ecologists have adopted this technique, constructing life tables for various plant and animal species
Three types of survivorship curves reflect important species differences in life history • Survivorship curves plot the proportion of individuals alive at each age Figure 35.6
35.7 Evolution shapes life histories • An organism's life history is the series of events from birth through reproduction to death • Life history traits include • the age at which reproduction first occurs • the frequency of reproduction • the number of offspring • the amount of parental care given • the energy cost of reproduction
Experimentaltransplant ofguppies • The effects of predation on life history traits of guppies has been tested by field experiments for several years Predator: Killifish;preys mainly onsmall guppies Guppies:Larger atsexual maturitythan those in “pike-cichlid”pools Predator: Pike-cichlid;preys mainly on largeguppies Guppies: Smaller atsexual maturity thanthose in “killifish” pools Figure 35.7A
The agave illustrates what ecologists call "big-bang reproduction" • It is able to store nutrients until environmental conditions favor reproductive success • In nature, every population has a particular life history adapted to its environment Figure 35.7B
Natural selection favors a combination of life history traits that maximizes an individual's output of viable, fertile offspring
Selection for life history traits that maximize reproductive success in uncrowded, unpredictable environments is called r-selection • Such populations maximize r, the intrinsic rate of increase • Individuals of these populations mature early and produce a large number of offspring at a time • Many insect and weed species exhibit r-selection
Selection for life history traits that maximize reproductive success in populations that live at densities close to the carrying capacity (K) of their environment is called K-selection • Individuals mature and reproduce at a later age and produce a few, well-cared-for offspring • Mammals exhibit K-selection
THE HUMAN POPULATION 35.8 Connection: The human population has been growing exponentially for centuries • The human population as a whole has doubled three times in the last three centuries • The human population now stands at about 6.1 billion and may reach 9.3 billion by the year 2050 • Most of the increase is due to improved health and technology • These have affected death rates
The history of human population growth Figure 35.8A
The ecological footprint represents the amount of productive land needed to support a nation’s resource needs • The ecological capacity of the world may already be smaller than its ecological footprint
Ecological footprint in relation to ecological capacity Figure 35.8B
The exponential growth of the human population is probably the greatest crisis ever faced by life on Earth Figure 35.8C
35.9 Birth and death rates and age structure affect population growth • Population stability is achieved when there is zero population growth • Zero population growth is when birth rates equal death rates • There are two possible ways to reach zero population growth (ZPG) • ZPG = High birth rates - high death rates • ZPG = Low birth rates - low death rates
The demographic transition is the shift from high birth and death rates to low birth and death rates • During this transition, populations may grow rapidly until birth rates decline Figure 35.9A
The age structure of a population is the proportion of individuals in different age-groups • Age structure affects population growth
RAPID GROWTH SLOW GROWTH ZERO GROWTH/DECREASE Kenya United States Italy Male Female Male Female Male Female Ages 45+ Ages 45+ Ages 15–44 Ages 15–44 Under15 Under15 Percent of population Percent of population Percent of population Figure 35.9B
They also indicate social conditions • Increasing the status and education of women may help to reduce family size • Age-structure diagrams not only reveal a population's growth trends
35.10 Connection: Principles of population ecology have practical applications • Principles of population ecology may be used to • manage wildlife, fisheries, and forests for sustainable yield • reverse the decline of threatened or endangered species • reduce pest populations
Renewable resource management is the harvesting of crops without damaging the resource • However, human economic and political pressures often outweigh ecological concerns • There is frequently insufficient scientific information
Estimates of cod stocks were too high • The practice of discarding young cod (not of legal size) at sea caused a higher mortality rate than was predicted • The collapse of the northern cod fishery
Collapse of northern cod fishery Figure 35.10A
For species that are in decline or facing extinction, resource managers try to increase population size • Carrying capacity is usually increased by providing additional habitat or improving the quality of existing habitat
Endangered species often have subtle habitat requirements • The red-cockaded woodpecker was recently recovered from near-extinction by protecting its pine habitat and using controlled fires to reduce undergrowth Figure 35.10B
Integrated pest management (IPM) uses a combination of biological, chemical, and cultural methods to control agricultural pests • IPM relies on knowledge of • the population ecology of the pest • its associated predators and parasites • crop growth dynamics • One objective of IPM is to minimize environmental and health risks by relying on natural biological control when possible