Download
1 / 39
390 likes | 550 Views
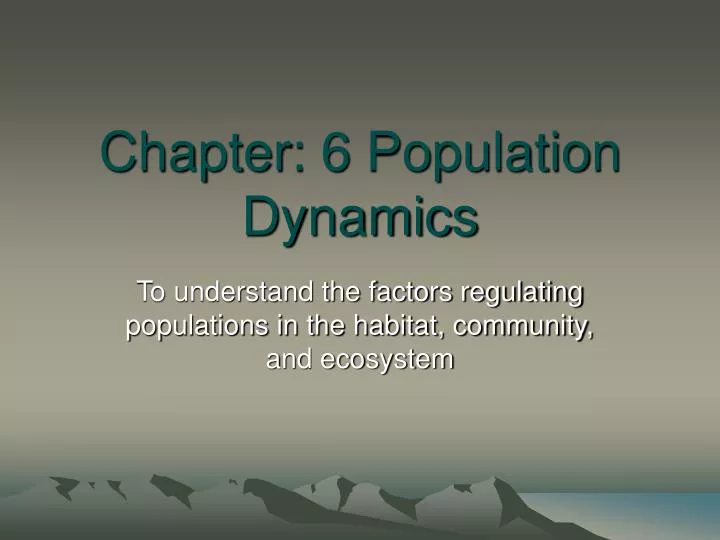
Chapter: 6 Population Dynamics. To understand the factors regulating populations in the habitat, community, and ecosystem. I. Dynamics of Population Growth. A. Exponential Growth and Doubling Times Ideal environmental conditions can cause a population to grow exponentially

E N D
Chapter: 6 Population Dynamics To understand the factors regulating populations in the habitat, community, and ecosystem
I. Dynamics of Population Growth • A. Exponential Growth and Doubling Times • Ideal environmental conditions can cause a population to grow exponentially • Exponential growth is growth at a constant rate (per unit of time) • Can be expressed as a constant fraction, or as an exponent, by which the original population is multiplied • Usually yearly in macro-organisms • Sometimes hourly or daily in micro-organisms
I. Dynamics of Population Growth • A. (cont) • Ex. 22, where the 2 is the exponential growth rate • 2, 4, 16, 64, etc. • Also called Geometric growth • the sequence of growth follows a geometric pattern of increase • Graphically looks like a J • Called a J-shaped curve • Sometimes called “unfettered” growth
I. Dynamics of Population Growth • A. (cont) • Population doubling times are necessary to predict the effectiveness of changes to the habitat • Useful rule of thumb to find doubling rates of the population is the 70 rule • Divide 70 by the annual percentage growth rate
I. Dynamics of Population Growth • A. (cont) • Ex. A population has an annual growth rate of 35%, therefore, the doubling time will be 70 / 35 = 2. Thus, the population will double every 2 years • Ex. The US population has a growth rate of 1.2%, What is the doubling time? (initial pop is 300 million) • 58 years, 300 million to 600 million
I. Dynamics of Population Growth • B. Arithmetic Growth • Less than ideal environmental conditions will produce a population growth rate that is a constant fraction that is added to the original population • Called Arithmetic Growth • Produces a straight line on a population graph
I. Dynamics of Population Growth • C. Biotic Potential • Based on the ability of an organism to reproduce • The maximum reproduction rate for an organism is its Biotic Potential
I. Dynamics of Population Growth • D. Population Oscillations and Irruptive Growth • In Vitro, populations can have no limits • In Situ, populations have limits • Negative growth rates occur when the population exceeds the carrying capacity for the habitat • The carrying capacity is the maximum number of organisms a habitat can have at any given time period
I. Dynamics of Population Growth • D. (cont) • Negative growth rates are called Dieback • The death rate is greater than the birth rate • A small population growth above the carrying capacity is called overshoot • A large population growth above the carrying capacity is called a population explosion • A large negative population growth rate is called population crash
I. Dynamics of Population Growth • D. (cont) • Malthusian Growth or Irruptive Growth is when there is a population explosion followed by a population crash • Populations grow until they exhaust resources (typically food) • May occur repeatedly • Can occur irregularly • Isle de Royal, Newfoundland Canada
I. Dynamics of Population Growth • E. Growth to a Stable Population • Internal and external factors which regulate population growth • “Harmony” with the environment • May initially experience exponential growth, but slow as resources dry up • Closer to carrying capacity • Called Logistic Growth Model • Add to growth rates, environmental resistance • Looks like an S, graphically, then the tail moves above and below the carrying capacity line • Also called a sigmoid curve
I. Dynamics of Population Growth • F. Chaotic and Catastrophic Population Dynamics • Since many population growth curves don’t follow linear growth curves, growth curves are called Chaotic • Exhibit variability • Non-random events • Minute differences in conditions, change the populations dramatically • Small events strung together form a large affect
I. Dynamics of Population Growth • F. (cont) • Catastrophe theory is hypothetical • Used by biologists to explain population dynamics showing abrupt discontinuities • Catastrophic systems may jump from one state to another • Chaotic systems can be predicted over a longer period of time, catastrophic can not
I. Dynamics of Population Growth • G. Population Growth Strategies • Malthusian growth strategies are followed by most animals in the lower trophic levels • Some are pioneers • Most are generalists • Use large numbers to offset predation • Little investment to the individual • Called Extrinsically (externally) controlled growth or, r-selected (strategies) controlled reproduction • Most insects, rodents, marine invertebrates, parasites, crustaceans use this method
I. Dynamics of Population Growth • G. (cont) • Logistic Strategies are followed by animals higher up the trophic levels • Larger organisms • Live longer • Mature slowly • Provides more care for offspring • Called intrinsically (internally) controlled growth, or k-selected (strategies) controlled reproduction
II. Factors that increase or decrease populations • A. Natality, Fecundity, and Fertility • Natality is the production of new individuals • Tied to nutrition, climate, soil, water, and species interactions for success • Fecundity is the physical ability to reproduce • Does not mean they will mate • Can have high fecundity without high Natality • Fertility is the number of offspring produced
II. Factors that increase or decrease populations • B. Immigrations • Introduced organisms into a new habitat or community • Ex: seeds, spores, boats, wind (floating) • Increases population growth rates • C. Mortality and Survivorship • Mortality is the ability to die • Called death rate • Number of living divided by the number of deaths in a given amount of time
II. Factors that increase or decrease populations • C. (cont) • Survivorship is more important to scientists • The percent of the population/ that survives to the next year • A cohort is all of the individuals that are born in a specific generation • Life expectancy is the probable number of years an individual will survive • Life span is the maximum number of years a person can survive • Very different amongst organisms
II. Factors that increase or decrease populations • C. (cont) • 4 Survivorship patterns • Type A • Tend to live full life expectancy • Low death rate in pre-reproductive and reproductive years • Higher death rate in post-productive years • [k-selected reproduction] • Ex bears, whales, humans, elephants
II. Factors that increase or decrease populations • C. (cont) • 4 Survivorship patterns • Type B • Death rate is unrelated to age • [k-selected reproduction] • i.e. constant over the life span • Ex. Seagulls
II. Factors that increase or decrease populations • C. (cont) • 4 Survivorship patterns • Type C • Tend to have high mortality rate in the pre-reproduction period (juvenile), once they reach the reproduction stage, very high survival rate until post-reproduction stage • [r-selected reproduction] • Ex. Song birds, rabbits, deer, etc.
II. Factors that increase or decrease populations • C. (cont) • 4 Survivorship patterns • Type D • Very high mortality rate in early life (most prey species), when they reach reproduction stage very low mortality rate, even through post-reproduction stage • [r-selected reproduction] • Ex. Crustaceans, fish, plants, insects
II. Factors that increase or decrease populations • D. Age Structure Diagrams • Combine mortality and natality • Proportions of individuals in various age classes • Pre-reproduction • Reproduction • Post-reproduction • Population momentum is dependant on the number of individuals in the pre-reproductive stage
II. Factors that increase or decrease populations • D. (cont) • Very large number, compared to reproductive group, is increasing population growth • Same size number, compared to reproductive group, is a stable population • Very small number, compared to reproductive group, is a decreasing population
II. Factors that increase or decrease populations • E. Emigration • The movement of organisms out of a population permanently • Different from migration • Migration is temporary and the organisms will return during the next cycle
II. Factors that increase or decrease populations • F. Population Growth Equation • PG(R) = (BR + I) – (DR + E) • PG = Population Growth (rate) • BR = Birth Rate • I = Immigration • DR = Death Rate • E = Emigration • Can be positive or negative • Growing population is positive • Decreasing population is negative
III. Factors that Regulate Population Growth • A. General Information • Can be intrinsic • Can be extrinsic • Can be biotic and/or abiotic • Can be density dependant • Can be density independent • Biotic regulators tend to be density dependant • Abiotic regulators tend to be density independent