Download
1 / 72
720 likes | 814 Views
Population Dynamics Chapter 6 Populations. AP Environmental Science GNHS. 4 types of Population Fluxes. Population flux – changes in pops over time. Advantage: Allows vegetation and organism reproduction time to recover Types: 1) stable 3) irregular

E N D
Population Dynamics Chapter 6 Populations AP Environmental Science GNHS
4 types of Population Fluxes • Population flux – changes in pops over time. Advantage: Allows vegetation and organism reproduction time to recover Types: 1) stable 3) irregular 2) irruptive 4) cyclic
Stable Pop Flux • Pop fluctuates around carrying capacity either slightly above or below • Typical of species in undisturbed tropical forests…little variation in average temp or rainfall.
Irruptive Pop Flux • Pop is normally stable but occasionally explodes (erupts) to peak and then crashes to stable lower level. • Ex: Racoon, house mouse
Irregular Pop Flux • Chaotic behavior in population size • No recurring pattern • May be due to: chaos in ecosystem
Cyclic Pop Flux Fluctuations in size that occur over a regular time period. Includes predator-prey (lynx and hare)
Population Dynamics Outline • Characteristics of a Population • Population Dynamics and Carrying Capacity • Reproductive Strategies • Conservation Biology • Human Impacts • Working with Nature
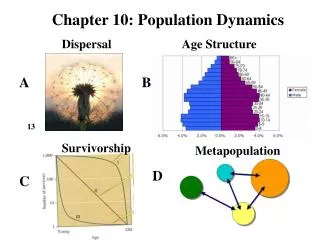
Characteristics of a Population • Population - individuals inhabiting the same area at the same time and can interbreed. • Population Dynamics: Population change due to • Population Size - number of individuals • Population Density - population size in a certain space at a given time • Population Dispersion - spatial pattern in habitat • Age Structure - proportion of individuals in each age group in population
Population Size • Natality • Number of individuals added through reproduction • Crude Birth Rate - Births per 1000 • Total Fertility Rate – Average number of children born alive per woman in her lifetime • Mortality • Number of individuals removed through death • Crude Death Rate Deaths per 1000
Population Growth • Populations show two types of growth • Exponential • J-shaped curve • Growth is independent of population density • Logistic • S-shaped curve • Growth is not independent of population density
Population Growth – “Mathway” Benefits: • Prediction of future generations • Creation of population trends • Assists in determining type of growth: exponential or logistics
Population Growth - Mathway Basic variables of population growth N=population number r = rate of growth t = Time in days, months, years, generations d = ‘delta” or change in (ex. dN = change in population) K = carrying capacity
Population Growth • Population growth depends upon • birth rates • death rates • immigration rates (into area) • emigration rates (exit area) Pop = Pop0 + (b + i) - (d + e) Zero Population Growth (b + i) = (d + e)
How is “r” determined? r = births – deaths Total Population (rN) Does not include immigration or emigration! Example: 20,000 births – 15,000 deaths 500,000 organisms Growth Rate (r) = .01 (x 100) = 1.0%
Exponential Growth Rules: If r ˂ 0, then dN is negative and population is declining. If r > 0, then dN is positive and population increases over time If r = 0, then dN is 0 → no change in population
Logistics Growth • Solve for the right side of the equation. • You must know your carrying capacity (K) Example; • Look at the N/K part. • If K=100 wolves, the maximum pop • If N =100 wolves, then N/K = 100 = 1 100
Logistics (cont) • If 1-N/K = 1-1 = 0 and rN (0) = 0 and dN/dt = 0. • This means no change in population because the population = carrying capacity. 6. What if N=50 and K=100, please calculate the outcome using the formula.
Logistics (cont) • Then N/K = 50/100 = ½. • 1-N/K = 1-1/2 = ½ • Rate of increase is ½ rN or half of the reproductive rate. • Try it with N=120 and K=100, what is the reproductive rate going to be?
Population Density • Population Density (or ecological population density) is the amount of individuals in a population per unit habitat area • Some species exist in high densities - Mice • Some species exist in low densities - Mountain lions • Density depends upon • social/population structure • mating relationships • time of year
Population Doubling Rule of 70 – used for determining how long it takes for a population to double. If a population grows at a rate of 7%, how long would it take to double? 70%, 70 / 14..7doubling = .7= 10 = r (% form) = rr (decimal form) ,.07 yrs. THIS IS THE DOUBLING TIME OF A POPULATION!!!is. It states that to find the doubling time of a quantity growing at a given annual percentage rate, divide the percentage number into 70 to r
Population Dispersion Population dispersion is the spatial pattern of distribution There are three main classifications Clumped: individuals are lumped into groups ex. Flocking birds or herbivore herds due to resources that are clumped or social interactions most common http://www.johndarm.clara.net/galleryphots/
Uniform: Individuals are regularly spaced in the environment - ex. Creosote bush due to antagonism between individuals, or do to regular spacing of resources rare because resources are rarely evenly spaced Random: Individuals are randomly dispersed in the environment ex. Dandelions due to random distribution of resources in the environment, and neither positive nor negative interaction between individuals rare because these conditions are rarely met www.agry.purdue.edu/turf/ tips/2002/clover611.htm Population Dispersion http://www.calflora.net/bloomingplants/creosotebush2.html
Age Structure • The age structure of a population is usually shown graphically • The population is usually divided up into prereproductives, reproductives and postreproductives • The age structure of a population dictates whether is will grow, shrink, or stay the same size
Age Structure Diagrams Positive Growth Zero Growth Negative Growth (ZPG) Pyramid Shape Vertical Edges Inverted Pyramid
Population Dynamics Outline • Characteristics of a Population • Population Dynamics and Carrying Capacity • Reproductive Strategies • Conservation Biology • Human Impacts • Working with Nature
Biotic Potential • factors allow a population to increase under ideal conditions, potentially leading to exponential growth • Environmental Resistance • affect the young more than the elderly in a population, thereby affecting recruitment (survival to reproductive age)
Biotic Potential • Ability of populations of a given species to increase in size • Abiotic Contributing Factors: • Favorable light • Favorable Temperatures • Favorable chemical environment - nutrients • Biotic Contributing Factors: • Reproductive rate • Generalized niche • Ability to migrate or disperse • Adequate defense mechanisms • Ability to cope with adverse conditions
Environmental Resistance • Ability of populations of a given species to increase in size • Abiotic Contributing Factors: • Unfavorable light • Unfavorable Temperatures • Unfavorable chemical environment - nutrients • Biotic Contributing Factors: • Low reproductive rate • Specialized niche • Inability to migrate or disperse • Inadequate defense mechanisms • Inability to cope with adverse conditions
Exponential Growth • As early as Darwin, scientists have realized that populations have the ability to grow exponentially • All populations have this ability, although not all populations realized this type of growth • Darwin pondered the question of exponential growth. He knew that all species had the potential to grow exponentially • He used elephants as an example because elephants are one of the slowest breeders on the planet
Exponential Growth One female will produce 6 young over her 100 year life span. In a population, this amounts to a growth rate of 2% Darwin wondered, how many elephants could result from one male and one female in 750 years? 19,000,000 elephants!!!
Population Dynamics and Carrying Capacity • Basic Concept: Over a long period of time, populations of species in an ecosystem are usually in a state of equilibrium (balance between births and deaths) • There is a dynamic balance between biotic potential and environmental resistance
Carrying Capacity (K) • Exponential curve is not realistic due to carrying capacity of area • Carrying capacity is maximum number of individuals a habitat can support over a given period of time due to environmental resistance (sustainability)
Logistic Growth • Because of Environmental Resistance, population growth decreases as density reaches carrying capacity • Graph of individuals vs. time yields a sigmoid or S-curved growth curve • Reproductive time lag causes population overshoot • Population will not be steady curve due to resources (prey) and predators