Download
1 / 5
50 likes | 97 Views
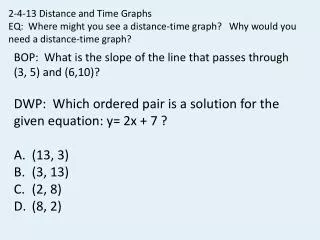
Drawing distance-time graphs. You can record the distances that an object travels and the time taken to travel those distances. The distance and time are measured from where and when the object started.

E N D
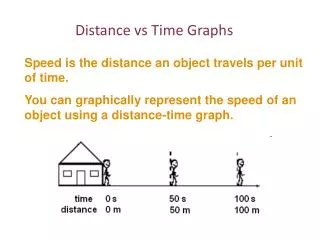
You can record the distances that an object travels and the time taken to travel those distances. • The distance and time are measured from where and when the object started. • You can plot this data on a distance–time graph. Time is usually plotted on the x-axis and distance on the y-axis.
Bob remembers that he left a light on so runs back covering the 300 m home in 2 minutes. • Bob goes for a walk from his house to a local shop to buy a paper. You can plot his journey on a distance–time graph as follows. • It takes them 5 minutes to buy the paper. 300 Distance from house (m) 150 0 2 4 6 8 10 12 14 • Bob walks 150 m from his house towards the newsagents for 2 minutes. Time (minutes) • Bob and his friend walk on together talking. They travel the remaining 150 m in 4 minutes. • He meets a friend and stops on the pavement talking for 1 minute.
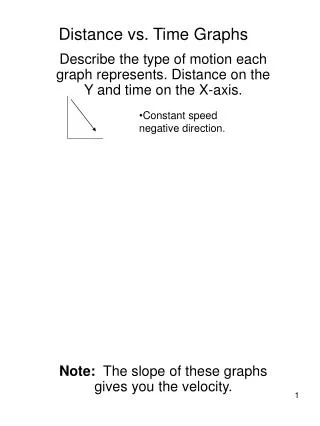
You can tell how fast something is moving by looking at the slope of the line. • If an object moves faster, it goes a greater distance for a given time and the slope of the line is steeper. If an object goes slower, it moves a smaller distance for a given time and the slope is less steep. • We call the slope the gradient of the graph. • The gradient of a distance–time graph represents speed. • If a distance–time graph has a straight slope, this tells you that the object is moving at a constant speed. • Where the line in a distance–time graph is horizontal, the object has not moved any distance – it is stationary.
You can interpret what happened by looking at the slope of the graph. • Bob was stationary while he was talking with his friend (part b) and while he was waiting to buy his paper (part d). • d 300 Distance from house (m) • c • b 150 • e • a 0 2 4 6 8 10 12 14 • Bob walked quicker by himself than with his friend. The gradient for part a is greater than for part c. Time (minutes) • Bob was travelling in the opposite direction in part e because the gradient is negative.