Download
1 / 26
300 likes | 358 Views
Distance-Time Graphs. EQAO loves these!. There is a sensor called a CBR that can hook up to a graphing calculator. It can make a graph of your distance from the wall over a minute or so of time. Plotting distance against time can tell you a lot about motion. Let's look at the axes: . 1. 1.

E N D
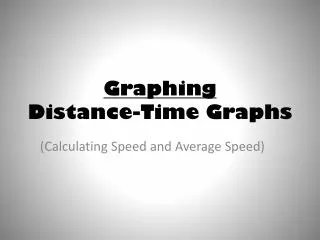
Distance-Time Graphs EQAO loves these!
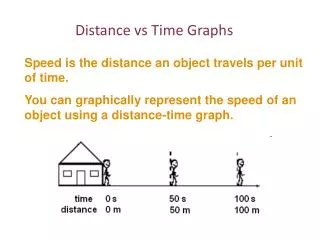
There is a sensor called a CBR that can hook up to a graphing calculator. It can make a graph of your distance from the wall over a minute or so of time.
Plotting distance against time can tell you a lot about motion. Let's look at the axes:
1 No Change in Distance.
1 No Change in Distance. Time is increasing to the right
1 No Change in Distance. Time is increasing to the right Object isn’t moving
2 Start far from the wall.
2 Start far from the wall. Distance to wall is decreasing. Moving at a steady speed.
2 Start far from the wall. Distance to wall is decreasing. Moving at a steady speed. End closer to wall.
2 Start far from the wall. Distance to wall is decreasing. Moving at a steady speed. End closer to wall. Walk to wall at constant speed.
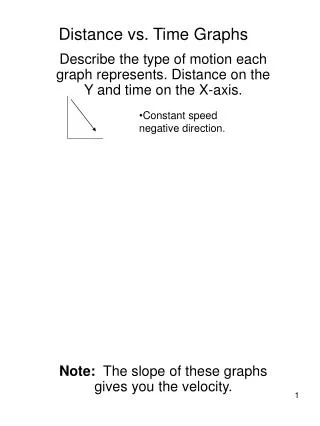
3 Walk away from wall at constant speed.
4 Dashed line is moving faster than solid line.
5 Starts walking away at a slow pace.
5 Speeds up. Starts walking away at a slow pace.
5 Speeds up even more. Speeds up. Starts walking away at a slow pace.
On straight lines speeds are constant. On curved lines, speeds are changing. 5 Speeds up even more. Speeds up. Starts walking away at a slow pace.
On straight lines speeds are constant. On curved lines, speeds are changing. 5 Speeds up even more. Speeds up. Starts walking away at a slow pace. Accelerate away from the wall.
6 Left speeds up. Right slows down.
An EQAO Question Dogs Versus Cats The Bryant Bulldogs basketball team takes the bus to play the Jordan High Thundercats. Describe the three parts of the Bulldogs’ bus trip, using the information on the graph. Include information about distance, time, direction and speed in kilometres per minute for each section of the graph.
Try it now: Describe the three parts of the Bulldogs’ bus trip, using the information on the graph.
Which graph represents Maya’s trip to school? • Maya walks to her friend Kadeem’s house, which is halfway between her home and the school. • They stay at Kadeem’s house for a few minutes, until Maya remembers that she has forgotten her lunch. • Maya runs back home to get her lunch. • When she gets home, her mother drives her to school so that she will not be late.
The relationship between t, the number of minutes Shufrah travels, and D, the distance she is from home, is shown on the grid below. Which of the following statements best describes the way Shufrah travels? • While travelling toward her home, Shufrah rides her bike, stops and then walks. • While travelling toward her home, Shufrah rides her bike, walks and then rides her bike. • While travelling away from home, Shufrah rides her bike, stops and then walks. • While travelling away from home, Shufrah walks, rides her bike and then walks.