Download
1 / 12
130 likes | 257 Views
Distance Time Graphs. Understanding and interpreting. Distance Time Graphs. Describing a journey made by an object is very boring if you just use words. As with much of science, graphs are more revealing.

E N D
Distance Time Graphs Understanding and interpreting
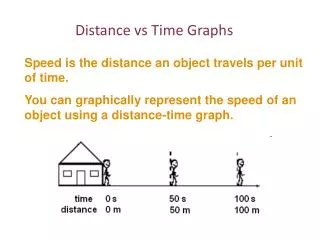
Distance Time Graphs • Describing a journey made by an object is very boring if you just use words. As with much of science, graphs are more revealing. • Plotting distance against time can tell you a lot about a journey. Let's look at the axes: • Time always runs horizontally (the x-axis). The arrow shows the direction of time. The further to the right, the longer time from the start. • Distance runs vertically (the y-axis). The higher up the graph we go, the further we are from the start.
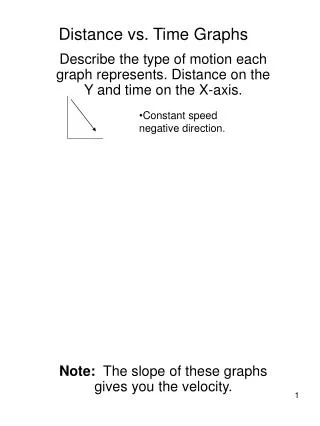
Not moving? This is what it looks like… If something is not moving, a horizontal line is drawn on a distance-time graph (dt-graph). • Time is increasing to the right, but its distance does not change. It is stationary.
Moving…. If something is moving at a steady speed, it means we expect the same increase in distance in a given time: • Time is increasing to the right, and distance is increasing steadily with time. It moves at a steady speed.
Steady Speed… • If something is moving at a steady speed, it means we expect the same increase in distance in a given time: • Time is increasing to the right, and distance is increasing steadily with time. It moves at a steady speed.
Can you describe what is going on here? • For the first part of the journey shown by the graph below, the object moved at a steady (slow) speed. • It then suddenly increased its speed, covering a much larger distance in the same time. • This sort of motion is not very realistic, but is easy to understand. It also makes calculations easier!
What is the effect of line ‘Steepness’, A.K.A slope… • Both the lines below show that each object moved the same distance, but the steeper yellow line got there before the other one: • A steeper gradient indicates a larger distance moved in a given time. In other words, higher speed. • Both lines are of constant gradient, so both speeds are constant.
The line below is curving upwards. This shows an increase in speed, since the gradient is getting steeper: In other words, in a given time, the distance the object moves is larger. It is accelerating.
There are three parts to the journey shown below: • Moving at a steady speed, slowlyNot moving for quite some time Moving again, but at higher speed • In all the graphs so far, we have not seen any numbers - it's about time we did!
Finding speed from these types of graphs! • We can see that the motion shown by the yellow line is fastest. • By definition, speed = distance / time so the steepness (or gradient) of the line will give us the speed! • Yellow: speed = distance / time = 30 m / 10 s = 3 m/s • Blue: speed = distance / time = 20 m / 20 s = 1 m/s
Calculate the speeds of different sections within a graph • Stage 1: speed = distance / time = 100 m / 10 s = 10 m/s • Stage 2: speed = distance / time = 50 m / 10 s = 5 m/s • Stage 3: speed = distance / time = 150 m / 20 s = 7·5 m/s