Download
1 / 82
820 likes | 828 Views
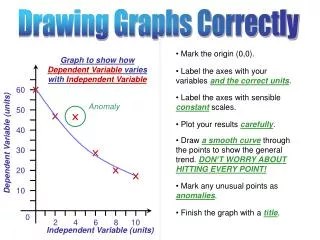
Drawing Graphs. Aidan O’Donnell Chang Kim Tom Burrows Waikato Part 1 Course 2015. What’s the point?. In the exam, success depends on facts expressed per unit time Viva SAQ Drawing a nice big clear graph is a good way to express your knowledge, look good and gain marks all at once.

E N D
Drawing Graphs Aidan O’Donnell Chang Kim Tom Burrows Waikato Part 1 Course 2015
What’s the point? • In the exam, success depends on facts expressed per unit time • Viva • SAQ • Drawing a nice big clear graph is a good way to express your knowledge, look good and gain marks all at once
What’s the point? • The number of graphs you need to be able to draw is finite • Practising with graphs is a sensible thing: • Consolidates your knowledge • Makes it easier and quicker in the exam • “Money for jam”
What’s the point? • We can’t cover every single graph here • We will start with 20 • The principles can be applied to other graphs you will come across in your revision
Plan for this session • Some sensible overview points • Each candidate: one graph • Couple of minutes to elaborate
Point 1: Consideration • Appreciate graphs from an examiner’s viewpoint
Point 2: Confidence • Draw big graphs • Take a fresh piece of paper for each new graph • Leave space to add more information
Point 3: Clarity • Draw simple graphs • Draw accurate graphs
Point 4: Score points • Learn to talk while drawing • Get to the money quickly • Label axes briefly • Draw graphs to the axes (where appropriate)
Point 5: Communicate • Employ buzz words • Only draw what can’t be spoken more effectively • Effective expression is more important than tidyness • Consider different colours
Graph 1 • Draw a spirometry trace
Fundamentals: • Accurate axes • Four volumes • Three capacities (ml/kg for all) • Point of lung-chest wall balance • FRC: definition and measurement • RV: definition and measurement • Changes with pregnancy
Graph 2 • Draw a graph of single-breath nitrogen washout
Fundamentals: • Buzzwords: • ‘Fowler’s method of measuring anatomical deadspace’ • ‘Rapid nitrogen analyser measurement’ • ‘Single breath 100% oxygen inhaled’ • Trigger Knowledge Boxes: • How to measure physiological deadspace? • Drawing expired nitrogen against time
Graph 3 • Draw a graph of the oxygen cascade
Fundamentals: • The six main steps • Explain the graph as you draw it • Trigger Knowledge Boxes: • The alveolar gas equation + values for all aspects • The cause for each drop • The Pasteur Point and its significance • Effect of altitude
Graph 4 • Draw the oxyhaemoglobin dissociation curve
Fundamentals: • The four standard conditions • p50, p75 and p97 • The sigmoid shape: positive cooperativity • Trigger Knowledge Boxes: • Saturation vs content • Mechanism of positive cooperativity • Changes in working muscle/placenta/fetus • Myoglobin
Graph 5 • Draw the flow-volume loop for the human lung
PEFR 10 5 Flow (l/s) TLC FRC RV 0 5 -5
Fundamentals: • Draw graph clockwise and talk as you go • Buzz Words • ‘Forced Vital Capacity/Total Lung Capacity inhalation’ • ‘Maximal expiratory effort’ • ‘Dynamic airway compression / Equal Pressure Point’ • Trigger Knowledge Boxes: • Obstructive/ restrictive exhalation changes • Extra-thoracic exhalation changes • Factors affecting dynamic airways compression
Graph 6 • Draw a graph of static lung compliance
Fundamentals: • The Graph: • Residual Volume At Y Axis • Extension to LEFT Of Y Axis • Buzzwords: • ‘Steady State’ • ‘Hysteresis’ • Trigger Knowledge Boxes: • Causes Of Hysteresis [6] • Parts Of Lung At Each Part Of Curve • Lung Effects At Extremes Of Curve
Graph 7 • Draw a graph to illustrate work of breathing
Fundamentals: • The Graph: • Draw curve anticlockwise and talk as you go • All negative inspiratory pressure • Y-axis starts at FRC • ‘Normal Breathing’ • Buzzwords: • ‘Non-Equilibrated Lung Units’ • Trigger Knowledge Boxes: • Slanting line is dynamic compliance
Graph 8 • Draw a graph of the central venous pressure
Fundamentals: • 3 peaks (a,c,v); 2 troughs (x,y) • Physiological causes Of waveform • Buzzwords: • Central venous pressure = right atrial pressure • Trigger Knowledge Boxes: • Factors affecting baseline (4) • Factors altering amplitude • Relationship to PAOP
Graph 9 • Draw a graph representing the waveforms as you advance a pulmonary artery catheter from the SVC into the PA
25/0 25/12 5 10 Should look like a normal CVP waveform Should have no notches! Diastolic pressure should be zero! Should look like a normal CVP waveform (higher baseline) Should look like a normal art line trace, with dicrotic notch Not a very good diagram!! A real catheter advances much more slowly than this, so many more examples of each waveform would be expected (e.g. several screens)
Fundamentals: • 4 phases (Pressures in each) • Buzzwords: • ‘Pulmonary artery flotation catheter’ (not ‘Swan’) • Talk about measured vs derived variables • Trigger Knowledge Boxes: • RA pressure • West zones • Pulmonary hypertension • How does PAOP relate to LVEDV? • Measurement of cardiac output
Graph 10 • Draw a pressure-volume loop for the left ventricle
Fundamentals: • The 10 pieces of data obtainable • The 3 phases of systole and 4 of diastole • Buzzwords: • ‘LV End Diastolic Volume’ • ‘Lusitropy’ • Trigger Knowledge Boxes: • Factors altering shape of graph • Factors affecting position of graph • Note: by convention, pressure is on the y-axis and volume on the x-axis (the opposite to those in respiratory physiology, e.g. graph 7)
Graph 11 • Draw a graph of the cardiac action potential
Fundamentals: • Phases 0 to 4 • Draw a clear X-axis • Contrast with: • Skeletal muscle cell action potential • Pacemaker action potential • Buzzwords: • ‘Action potential of ventricular myocyte’ • ‘All or nothing phenomenon’ • Absolute vs relative refractory periods • Relationship to ST segment of ECG