Download
1 / 38
380 likes | 389 Views
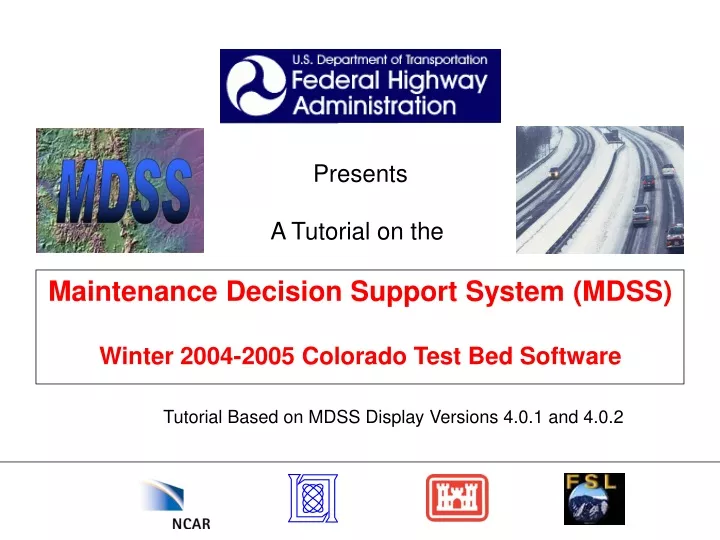
Presents A Tutorial on the Maintenance Decision Support System (MDSS) Winter 2004-2005 Colorado Test Bed Software. Tutorial Based on MDSS Display Versions 4.0.1 and 4.0.2. What is the Maintenance Decision Support System (MDSS) Demonstration?.

E N D
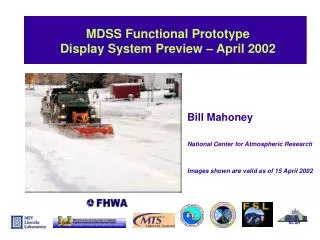
Presents A Tutorial on the Maintenance Decision Support System (MDSS) Winter 2004-2005 Colorado Test Bed Software Tutorial Based on MDSS Display Versions 4.0.1 and 4.0.2
What is the Maintenance Decision Support System (MDSS) Demonstration? The MDSS is a complex system that merges state-of-the-art weather forecasting with computerized roadway maintenance rules of practice. Output from the system consists of a series of optimized road treatment guidance geared specifically for winter road maintenance managers. In order to demonstrate this capability, the Federal Highway Administration (FHWA) is sponsoring field tests. The E-470 Public Highway Authority and Colorado DOT will participate in the winter 2004-2005 test bed demonstration. Several mesoscale weather models will be run in support of the MDSS project. Output from the models can be viewed at: http://laps.fsl.noaa.gov/mdss/ Click for Next Slide
Disclaimer – Experimental Capability The MDSS test bed products are provided “as is”. It is not meant to be an operational system and the output are being evaluated for possible future use and for ways that the system can be improved. Restricted versions of the display software may not contain all of the functionality shown in this tutorial. Documentation, restricted-access and training software and other helpful materials can be found at: http://www.rap.ucar.edu/projects/rdwx_mdss/index.html To operate the MDSS software, you must first download and install Java Web Start from http://java.sun.com/products/javawebstart/ Click for Next Slide
Starting the MDSS Application… Invoking the “Java Web Start” application from your start menu will initially bring up the above graphic as the system initializes. This may take several seconds. Once initialized, you will be presented with a screen similar to the one shown above. Highlight the “Colorado MDSS Display” option and click on “Start” Click for Next Slide
A splash screen will be presented while the java application loads… Click for Next Slide
Welcome to the MDSS Main Screen Display. It is composed of 4 main parts: Road & Weather Alerts State Alerts and Local Routes Weather Parameters Time Selection and Animation Click for Next Slide
The Alert Status Screen The Alert Status Screen provides a quick status of the region shown in the map display. Worst case forecast weather and road conditions statewide through 48 hours. Forecasts broken down into strategic planning periods. New for 2005 – A Bridge Frost Advisory. Clicking the color legend brings up category details Click for Next Slide
MDSS Alert Category Classification These alert categories are configurable Weather Alerts Road Alerts Click for Next Slide
Route views are selected from the pull down menu. The state map is broken down into county forecast zones State Map Each county is filled with the color of the worst condition at any forecast point within the 48 hour forecast. Click for Next Slide
Specific Routes within the demonstration region are highlighted and color coded according to the worst conditions within 48 hours Treatment recommendations are calculated for the thick/color-coded routes. Click for Next Slide
Weather parameters can be displayed on the state and route maps by clicking on the radio buttons Click for Next Slide
Selecting “Weather Alert Cat” displays color coded forecast points across the state and route domains for the selected hour. Select route views from Pull down menu. Color scales on the map are the same as on the state and route views. Click for Next Slide
Weather Alert Categories are depicted at specific forecast points Color codes correspond to alert categories at a specific hour Click for Next Slide
Forecast Point Status Display Red tick shows selected time Place cursor over a forecast point Forecast weather categories at this site Forecast date/time weather category & reason for the alert Click for Next Slide
Forecast Road Condition Status Display Red bar shows selected time Place the cursor over a route Forecast road conditions along this route at the selected time with no treatments. Click for Next Slide
Time Series Display Left clicking on a forecast point displays time series graphics for that location. Click for Next Slide
Top Half of the Weather Time Series Screen Current Time User Selected Time Weather Alert Air Temp & Dew Point Wind Speed Wind Direction Precip Type Click for Next Slide Precip Rate
Bottom Half of the Weather Time Series Screen Snow Rate Total Snow Accum Precip Probability A tabular view with probabilistic precipitation type information is available by clicking here. Click for Next Slide
Tabular Output for each Forecast Point Conditional Precipitation Type Probabilities Probabilities of Rain, Snow, Ice, overall chance of precipitation, and declared precipitation type are presented in tabular form. This allows operators to assess the precipitation type if precipitation were to occur. In the highlighted part of this example, no rain is predicted (“none”), but if precipitation were to occur, there is a 100% chance it would be rain. Click for Next Slide
Missing data sites are shown as black dots. Quick Tour: Working With Road Temperatures Placing your cursor over an RWIS site will bring up the latest data from all sensors. Click for Next Slide
Categories for Blowing Snow and Bridge Frost are titled the same (e.g., “poor”, “extreme”) as for Weather and Road conditions. Quick Tour: Blowing Snow and Bridge Frost Alerts • Blowing Snow Alerts are determined by several factors including: • Time since snow ended • Predicted wind speed and gusts • Occurrence of liquid precipitation since it snowed • Maximum temperatures at end of snow event • Bridge Frost Alerts are based on: • Bridge pavement temperature • Dew point (frost point) temperature • Length of time frost formation is predicted Click for Next Slide
Quick Tour: Blowing Snow and Bridge Frost Alerts Blowing Snow and Bridge Frost Alerts are also depicted near the treatment time bar to give the users an indication that blowing snow and/or bridge frost treatments may be required. Bridge frost always assumes a clean road (no chemicals)! Click for Next Slide
Operating the Time Selection Function The “Selected Time” bar allows the operator to observe predicted data at any hour of the forecast period. To change the time selection, place your cursor on the yellow time marker and slide it left or right. The forecast point data (main map) change according to the forecast at the specific time. The full forecast time periods can be animated by using these controls. Click for Next Slide
Then using the pull down list, select a route to view. MDSS Treatment Recommendations To select a route to observe or modify treatments, you must first be in a route view (versus state view). Click for Next Slide
MDSS Treatment Recommendations Note: The MDSS display is being made available to MDSS stakeholder group. However, viewing actual treatments, setting system configuration parameters and displaying the treatment histories are not available to restricted-access users (general public). Click for Next Slide
MDSS Treatment Recommendations The default treatment screen shows forecast mobility index values with and without the recommended treatment where (1.0 being the best – dry road). In this case, wet and snowy roads result in lower mobility. The MDSS automatically generates recommended treatments when the MDSS predictions indicate deteriorating weather conditions. Two MgCl2 treatments were recommended for this case due to rain-to-snow conditions. Click for Next Slide
MDSS Treatment Recommendations You can click on each checkbox to access each road condition parameter. In this case “Snow Depth” has been selected. Without a treatment, the forecast is for 1 inch of snow to accumulate on the road. Following the recommended treatment provides guidance on keeping snow accumulations in check. Click for Next Slide
Clicking on the last option brings up the Road Chemical Concentration trace MDSS Treatment Recommendations (Iowa example) Clicking on the third option brings up the Road Surface Temperature trace Click for Next Slide
MDSS Treatment Recommendations (Iowa example) The operator can try “what-if” scenarios to see how different chemical dispersion rates or application timing effects the predicted outcome. To try an alternative treatment scenario, click this button. Click for Next Slide
Treatment “What-If” Scenarios (Iowa example) The “Alternative 1” treatment block opens along with three options: Select: Use to make this alternative the “current plan”* Delete: Use to remove the alternative plan Calculate: Use this first to generate an alternative plan Click for Next Slide *Not available on restricted versions
Treatment “What-If” Scenarios (Iowa example) Material selections Can be customized. Chemical dispersion amounts range from 100 to 550 pounds per lane mile in increments of 50 pounds. Use the “Add” or “Delete” buttons to control the treatment directives. Select the treatment start time Treatment specifics accumulates in the “Treatment” window. Click on each line to make that treatment active. Click for Next Slide
Treatment “What-If” Scenarios In this example, the alternative treatment is changed to a single application of 100 pounds/lane mile of MgCL2. The dark blue line above shows that the single treatment only protects the road for a short period. Thereafter snow begins to accumulate on the road. Click for Next Slide
Treatment “What-If” Scenarios (Iowa example) When a treatment has been picked as the operational selection, then click on the “select” button and the selected Treatment will become the “current plan”. (Note: this feature is not active on restricted-access versions of the display) Click for Next Slide
Functionality Wrap-Up There are four buttons along the top of the “Route Selection” tab. These are: Event Summary: Provides a weather and treatment recommendation summary for the user in time series graphics Treatment History: Shows the treatment recommendations and selections for the last several model runs (not available in restricted-access versions) Treatment Selector: Opens the treatment selection window (we’ve already seen this) Configuration: Allows changing of shift scheduling and shift splitting (not available in restricted-access versions) Click for Next Slide
Event Summary Table An easy way to visualize the probabilistic forecasts of each precipitation type Snow accumulation on the road with no treatment Road Temps with recommended treatment Forecast wind speeds, blowing snow and treatment recommendations Click for Next Slide
Configuration Page Reset Segments: If the actual treatments performed by the user were not entered into the MDSS, then the system will not know the current road conditions at the start of the next update cycle. If the user knows that the road are clear of snow and ice, then the road conditions can be ‘reset’ for each plow route or all plow routes. By resetting the roads, the MDSS will be properly initialized for the next winter event. Set Shifts: The MDSS indicates shift times, by highlighting them on the time bar. The shift periods can be adjusted as shown on the left.
Functionality Wrap Up Treatment history over the last 3 updates (9 hrs period) can be viewed on this page. A text and graphical view is available. Click for Next Slide
Thank You On behalf of the Federal Highway Administration and the national laboratories involved in the MDSS project, thank you for your interest. For additional information on the MDSS project, please visit the following web sites: The Federal Highway Administration, Road Weather Management Program site at: http://www.ops.fhwa.dot.gov/weather/index.htm The National Center for Atmospheric Science (NCAR) web site at: http://www.rap.ucar.edu/projects/rdwx_mdss/index.html Correspondence regarding the technical questions regarding the MDSS project and its materials can be directed to Bill Mahoney or Bill Myers at NCAR at mahoney@ucar.edu or myers@ucar.edu