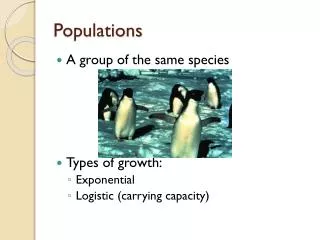
Download

1 / 12
120 likes | 124 Views

E N D
“figure 1.1 shows, real incomes (measured as either real wages or per capita gross national product [ GNP] ) have grown by a factor of between thirteen and eighteen since the first half of the nineteenth century. An examination of real wages shows that they grew by about 1 percent annually between 1800 and 1900 and at an accelerated rate between 1900 and 1950.” Piece-wise exponential growth, but what exactly do the slopes mean for human beings?
“Quantitative estimates of the growth of real wages or real output have an oft forgotten Achilles heel. While it is relatively easy to calculate nominal wages and outputs, conversion of these into real output or real wages requires calculation of price indexes for the various components of output. The estimates of real income are only as good as the price indexes are accurate. During periods of major technological change, the construction of accurate price indexes that capture the impact of new technologies on living standards is beyond the practical capability of official statistical agencies. The essential difficulty arises for the obvious but usually overlooked reason that most of the goods we consume today were not produced a century ago. We travel in vehicles that were not yet invented that are powered by fuels not yet produced, communicate through devices not yet manufactured, enjoy cool air on the hottest days are entertained by electronic wizardry that was not dreamed of, and receive medical treatments that were unheard of. If we are to obtain accurate estimates of the growth of real incomes over the last century, we must somehow construct price indexes that account for the vast changes in the quality and range of goods and services that we consume, that somehow compare the services of horse with automobile, of Pony Express with facsimile machine, of carbon paper with photocopier, … “
… leads to the conclusion that, when quality improvements are taken into account, real wages may have increased by a factor that ranges from 40 (the low-bias case) to 190 (the high-bias case) over the period 1800-1992. The conventional (non-Nordhaus corrected) growth of real wages has been a factor of 13-18 over this period. This is clearly a very large miss. The magnitude of this result may incline some readers to skepticism. However, the size of the quality correction for lighting should evoke no surprise from those familiar with the paper by Cole et al. (1986) on adjusting the price of computers for quality change. That paper implied that quality improvements in computing equipment have proceeded at double-digit rates (10 to 20 percent per year) for several decades. In light of the Cole paper, a major contribution of the current paper is to show that the computer result is not an isolated phenomenon. 10 % increase per year means doubling approximately every 7 years, 20 % in half that time With this kind of approach on to modeling the costs of climate change and developing predictive models
Nordhaus pioneered the development of integrated assessment models His models have three interacting modules: A carbon-circulation module This describes how global CO2 emissions influence CO2 concentration in the atmosphere. It reflects basic chemistry and describes how CO2 emissions circulate between three carbon reservoirs: the atmosphere; the ocean surface and the biosphere; and the deep oceans. The module’s output is a time path of atmospheric CO2 concentration. A climate module This describes how the atmospheric concentration of CO2 and other greenhouse gases affects the balance of energy flows to and from Earth. It reflects basic physics and describes changes in the global energy budget over time. The module’s output is a time path for global temperature, the key measure of climate change. An economic-growth module This describes a global market economy that produces goods using capital and labor, along with energy, as inputs. One portion of this energy comes from fossil fuel, which generates CO2 emissions. This module describes how different climate policies – such as taxes or carbon credits – affect the economy and its CO2 emissions. The module’s output is a time path of GDP, welfare and global CO2 emissions, as well as a time path of the damage caused by climate change.
What to do? It is an international problem, many economically less developed countries will be hit hardest if nothing is done very soon … But if nothing is done, life on earth as we know will be over. (Kurzweil’s technological singularity is just a fantasy and transhumanistic philosophy is just an excuse to postpone significant changes to the detriment of people in the poorer countries.)
Why is this so, what can be done about it? and now to Romer and the difference between science and politics Growth rate compounds,
“Politics does not lead to a broadly shared consensus. It has to yield a decision, whether or not a consensus prevails. As a result, political institutions create incentives for participants to exaggerate disagreements between factions. Wordsthat are evocative and ambiguous better serve factional interests than words that are analytical and precise.Science is a process that does lead to a broadly shared consensus. It is arguably the only social process that does. Consensus forms around theoretical and empirical statements that are true. Tight links between words from natural language and symbols from the formal language of mathematics encourage the use of words that are analytical and precise. For the last two decades, growth theory has made no scientific progress toward a consensus.The challenge is how to model the scale effects introduced by nonrival ideas. … McGrattan and Prescott (2010) is one of several papers by traditionalists that use mathiness to campaign for price-taking models of growth. The natural inference is that their use of mathiness signals a shift from science to academic politics, presumably because they were losing the scientific debate. If so, the paralysis and polarization in the theory of growth is not a sign of a problem with science. It is the expected outcome in politics. “…
… “The market for mathematical theory can survive a few lemon articles filled with mathiness. Readers will put a small discount on any article with mathematical symbols, but will still find it worth their while to work through and verify that the formal arguments are correct, that the connection between the symbols and the words is tight, and that the theoretical concepts have implications for measurement and observation. But after readers have been disappointed too often by mathiness that waste their time, they will stop taking seriously any paper that contains mathematical symbols. In response, authors will stop doing the hard work that it takes to supply real mathematical theory. If no one is putting in the work to distinguish between mathiness and mathematical theory, why not cut a few corners and take advantage of the slippage that mathiness allows? The market for mathematical theory will collapse. Only mathiness will be left. It will be worth little, but cheap to produce, so it might survive as entertainment.” Well, that’s what real scientists do, it is not considered rude to state very clearly what one thinks, science can only progress by resolving controversies ….
The economic facts on the ground R. Jones, Seminar at Portland State Univ. 2018 If there was a “new economy”, it was less dynamic than the postwar decades. Since the global financial crisis, productivity growth lowest in living memory !!