Download
1 / 31
310 likes | 466 Views
Week 5: Human population as environmental factor. Chapter 5 B&K Rates of growth The prophecy of Malthus and quality of life Population growth and exponential growth The logistic growth curve and human population Limiting factors Age Structure Fertility rates and life expectancy

E N D
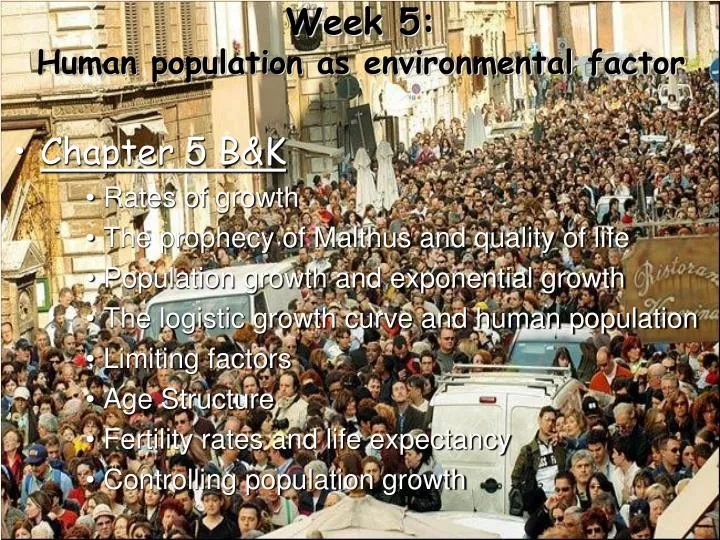
Week 5:Human population as environmental factor • Chapter 5 B&K • Rates of growth • The prophecy of Malthus and quality of life • Population growth and exponential growth • The logistic growth curve and human population • Limiting factors • Age Structure • Fertility rates and life expectancy • Controlling population growth
The prophecy • Famine seems to be the last, the most dreadful resource of nature. The power of population is so superior to the power in the earth to produce subsistence for man, that premature death must in some shape or other visit the human race. The vices of mankind are active and able ministers of depopulation. They are the precursors in the great army of destruction; and often finish the dreadful work themselves. But should they fail in this war of extermination, sickly seasons, epidemics, pestilence, and plague, advance in terrific array, and sweep off their thousands and ten thousands. Should success be still incomplete, gigantic inevitable famine stalks in the rear, and with one mighty blow levels the population with the food of the world.
Environmental ProblemsWhat’s your top priority? • Climate Change • Biodiversity • Air pollution • Water pollution • Solid waste • Loss of wilderness • Six Billion Human Beings (explore world population growth)
Total Fertility Rate (TFR) • The average number of children expected to be born to a woman during her lifetime. • Note that demographers and population scientists usually express population size as the number of females in a population and ignore males. • How do social practices affect fertility? • For example: polygamy in Arab countries, among early Mormans? • For example: preference for males in China? • Six Billion Human Beings (learn about TFR)
Basic Concepts • Rates of Growth • Growth rates—inversely related to a nation’s per capita income; positive feedback loop increasing poverty. • Populations, Density, and Consumption (technology) • Population impact: number of people and environmental impact per person. • Total environmental impact of a population = number of people (population) x impact per person (Consumption & technology); raising either variable increases the total impact. • Impact depends on consumption rates and population density. • Dense populations have large local impact. • Consumptive populations have large global reach and utilize vastly more resources.
Human Population Eras • Early hunter-gatherers ~few million people.Growth rate <0.0001% • Early agriculture – first rise of population.Growth rate ~0.03% • Industrial revolution – improvements in health care & food supply lead to sharp increase in human population.Growth rate ~0.1% • Today – slowing rate of population growth for Europe and U.S., rapid in Asia, Africa, South America. Growth rate 1.4-2%
Population dynamics • The crude birthrate of a population is the number of births per 1000 individuals in a population. • The crude growth rate is the crude birthrate minus the crude death rate, or the net change in a population of 1000 over a year. • Maximum lifetime is the maximumpossible age for an individual of a species. • Life expectancy is the average remaining years of an individual at a given age; it is often used to refer to the average lifespan of individuals in a population.
Quiz 5a • Assume that the rate of increase for goats is 14% per year. At this rate, if Mr. Champini’s herd of 150 goats had not been stolen by bandits, it would have increased to how many after 5 years? a) 2,521,018; b) 200; c) 3000; d) 300; e) 600. • The Geographic Positioning System uses what principle to locate objects on earth? a) synchronized detection of laser pulses; b) radio signals from an array of transmitter towers; c) precise measurement of distance to satellites whose exact orbit is known; d) receivers in a series of satellites detect the GPS position and transmit it back to the user; e) position of celestial bodies such stars and planets. • The prophecy of Malthus predicts that human population will increase without limit until all only humans remain on Earth. a) True; b) False. • A major cause for population increase has been: a) rising birth rates; b) falling death rates; c) rising birth rate & falling death rate; d) improved educational; e) none of these
Equations of Population Change • Population size P2 = P1 + (B – D) + (I – E) • Growth rate g = (B-D)/N(Births-Deaths)/Number of people • Exponential growth & doubling time Pt = P0 exponent gt Doubling time = 70/g% • If world growth rate is 1.75%, doubling time is 70/1.75 = 40 years
Demographic Changes Among Regions • Modern history is dominated by population shifts—Do consumption patterns match?
Total Fertility Rates and Pop. Growth • Population growth depends more on TFR than life expectancy. • However, survival to child-bearing ages is a crucial factor. • The TFR in future populations will have major impact on population growth.
Demography • Age Structure • Numbers of people and gender balance • Demographic transition (rem logistic curve) • Total Fertility • Population and environment • Death rate and environment • Population change and standard of living • Six Billion Human Beings (learn about age structure and survival rates)
Replacement-level fertility and momentum • The TFR required for a population to remain constant is about 2.1 children/female. • Even if birth rates are declining in a population, population momentum will cause population to grow after replacement-level TFR is achieved. • Why?
Pop. Growth and the Logistic Curve • The logistic curve predicts that growth will slow as a population approaches its carrying capacity. • Change from increase to maintenance rates of growth called demographic transition. • Can this information be used to predict eventual size of human population?
Demographic Transition • Note that limits to human population levels reflect societal choices rather than limiting factors that control wildlife populations. • What limits do affect population growth?
The Carrying Capacity of Earth • Improving the standard of living in poor countries by traditional means may negate the benefits of controlling population growth. Why? • Earth’s maximum sustainable human population cannot be calculated without making value judgments about the quality of life we desire for that population. • To what degree do Earth’s populations (nations or societies) compete for resources?
Limiting Factors ·Limiting factors are those which limit population growth; they may be short-term (limiting growth within one year of occurrence), intermediate-term(limiting growth after one year but before 10 years of occurrence) or long-term(limiting growth ten or more years after occurrence).
Limiting factors cont. ·The food supply is the resource most susceptible to constraint by short-term limiting factors. Some forms of pollution, energy shortages, desertification, and disruption in supply of renewable and non-renewable resources are examples of intermediate-term limiting factors. • Long-term limitingfactors include soil erosion, groundwater depletion, and global climatic changes and pollution effects. ·The declining per capita availability of certain biological resources suggests a human population near or beyond its current long-term carrying capacity.
Limits to Growth • Food supply: • 1984: 346 kg per capita • 1994: 311 kg per capita • Land/soil resources • Decline since 1954 to 1.7 ha per capita • Predict in 2050 1.0 ha per capita • Water resources • 350 to 1000 l/day developed countries – 2 to 5 l/day in developing countries • Population density source http://www.photius.com/wfb1999/rankings/population_density_0.html • Hong Kong: 6,570 people/km2 • Netherlands: 466 people/km2 • Africa (all): 66 people/km2 • United States: 30 people/km2
China • Population: 1.25 billion • 134 people/km2 • Birth rate: 1.5% • (U.S. 1.4%) • One-child policy • Rapid economic growth
China is now experiencing a demographic bonus due to having a high proportion of productive adults relative to children. • As China changes its standard of living, resource usage—particularly water use—will have a profound impact. • Aging, gender balance and population growth will remain important issues. • Six Billion Human Beings (Check current population size)