Download
1 / 20
230 likes | 399 Views
Frequency Domain Processing. C. Andr és Méndez March 26 th 2013. Sommario. Ripasso sull’analisi di Fourier e il trattamento numerico dei segnali Transformata di Fourier in MatLab. Segnali e Spettri. Fourier Transform. Inverse Fourier Transform. Getting to know the FFT.

E N D
Frequency Domain Processing C. Andrés Méndez March 26th 2013
Sommario • Ripasso sull’analisi di Fourier e il trattamento numerico dei segnali • Transformata di Fourier in MatLab
Segnali e Spettri Fourier Transform Inverse Fourier Transform
Getting to know the FFT • What is the FFT? FFT = Fast Fourier Transform. The FFT is a faster version of the Discrete Fourier Transform (DFT). The FFT utilizes some clever algorithms to do the same thing as the DTF, but in much less time. • Ok, but what is the DFT? The DFT is extremely important in the area of frequency (spectrum) analysis because it takes a discrete signal in the time domain and transforms that signal into its discrete frequency domain representation. Without a discrete-time to discrete-frequency transform we would not be able to compute the Fourier transform with a microprocessor or DSP based system.
Getting to know the FFT (2) • For example, if a sequence has N points, and N is an integral power of 2, • then DFT requires N2 operations, • whereas FFT requires complex multiplication, • complex additions and • subtractions. • For N = 1024, the computational reduction from DFT to FFT is more than 200 to 1.
Discrete Fourier Transform, Example • Given the sequence x[n]=(1,2,1) • Calculate the DFT
Discrete Fourier Transform, Example (3) • In Matlab • x = [1 2 1]; • xfft = fft(x) • Result: • xfft = • 4.0000 • -0.5000 - 0.8660i • -0.5000 + 0.8660i
Trasformata di Fourier 1-D • Ogni segnale può essere descritto dalla somma di sinusoidi con differenti ampiezze e frequenze. • I comandi MatLab per calcolare la trasformata di Fourier e la sua inversa sono rispettivamente fft e ifft. • Esercizio1 • Supponiamo di avere 10 campioni di un segnale casuale (rand) • Calcolare la FFT del segnale • Calcolare la IFFT del segnale • Estrarre al parte reale della IFFT • Confrontare il risultato della IFFT con il segnale di partenza
Forma d’onda e spettro di ampiezza • Esercizio 2 • Supponiamo di campionare un segnale ogni 0.01 secondi per la durata di 4 secondi • Il segnale è dato dalla somma di due sinusoidi di ampiezza A 3 e 5 e frequenza f 4 e 2 (ω=2πf) rispettivamente • Generare il grafico tempo – ampiezza (usare il comando axis per aggiustare la scalatura degli assi)
Forma d’onda e spettro di ampiezza (2) • Con la Trasformata di Fourier possiamo visualizzare cosa caratterizza maggiormente il segnale. • Calcolare la fft del segnale • Calcolare il suo valore assoluto e normalizzarlo • Plottare lo spettro di ampiezza
Filtraggio del rumore dai segnali • Vediamo come usare la fft e la ifft per filtrare il rumore dai segnali. • Esercizio 3 • Aggiungere al segnale dell’esercizio precedente del rumore casuale • Calcolare la trasformata del segnale rumoroso • Calcolare lo spettro di ampiezza • Plottare la forma d’onda e lo spettro di ampiezza
Filtraggio del rumore dai segnali (3) • Attraverso la ifft filtriamo il rumore. Il comando fix arrotonda gli elementi del suo argomento all’intero più vicino. • Settare i numeri <100 a zero (della transformata originale, senza processare) • ifft dei dati trasformati ed estrarre la parte reale • Plottare l’andamento dei campioni corretti
FFT in Matlab, numero di punti calcolati • Sintassi: fft(x,N) • N= numero di punti calcolati per la FFT • Qual è l'effetto di modificare N? • Eercizio 4 • Sintetizzare un coseno con 30 campioni e 10 campioni per periodo • Definire 3 valori diversi per N: 64,128,256 • Plottare i 3 casi • Cosa sucede se N è uguale al numero di campioni in x?
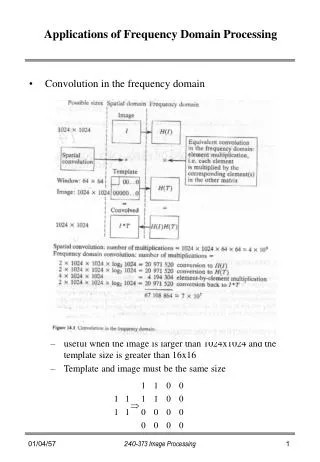
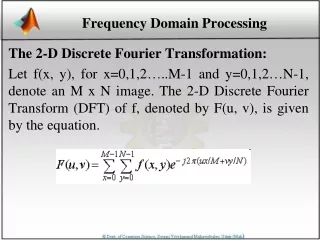
Elaborazione nel dominio della frequenza • The general idea is that the image (f(x,y) of size M x N) will be represented in the frequency domain (F(u,v)). The equation for the two-dimensional discrete Fourier transform (DFT) is: • The concept behind the Fourier transform is that any waveform that can be constructed using a sum of sine and cosine waves of different frequencies. The exponential in the above formula can be expanded into sines and cosines with the variables u and v determining these frequencies. • The inverse of the above discrete Fourier transform is given by the following equation: • Thus, if we have F(u,v), we can obtain the corresponding image (f(x,y)) using the inverse, discrete Fourier transform.
Visualizzazione dello spettro • Esercizio 5 • Creare un’immagine 30x30 con un rettangolo bianco su sfondo nero • Calcolare la DFT e visualizzare lo spettro di ampiezza (fft2) • Aggiungere dello zero padding per migliorare il calcolo della DFT • Shiftare la componente zero al centro dello spettro (fftshift) • Per migliorare la visualizzazione usare la funzione log • Suggerimento per la visualizzazione usare imshow(f,'InitialMagnification','fit')
Visualizzazione dello spettro (2) original DFT Zero-padded DFT Centered and Log