Download
1 / 24
300 likes | 552 Views
Frequency Domain Processing (part 2) and Filtering . C. Andr és Méndez 03/04/2013. Where to find the presentations?. http://profs.sci.univr.it/~mendezguerrero. Elaborazione nel dominio della frequenza.

E N D
Frequency Domain Processing (part 2)and Filtering C. Andrés Méndez 03/04/2013
Where to find the presentations? http://profs.sci.univr.it/~mendezguerrero
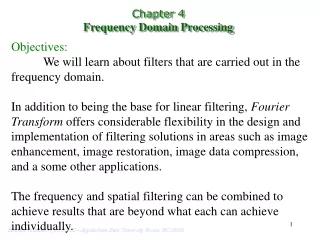
Elaborazione nel dominio della frequenza • The general idea is that the image (f(x,y) of size M x N) will be represented in the frequency domain (F(u,v)). The equation for the two-dimensional discrete Fourier transform (DFT) is: • The concept behind the Fourier transform is that any waveform that can be constructed using a sum of sine and cosine waves of different frequencies. The exponential in the above formula can be expanded into sines and cosines with the variables u and v determining these frequencies. • The inverse of the above discrete Fourier transform is given by the following equation: • Thus, if we have F(u,v), we can obtain the corresponding image (f(x,y)) using the inverse, discrete Fourier transform.
Visualizzazione dello spettro • Esercizio 1 • Creare un step 2D binario • Calcolare la DFT e visualizzare lo spettro di ampiezza (fft2) • Shiftare la componente zero al centro dello spettro (fftshift) • Per migliorare la visualizzazione usare la funzione log • Suggerimento per la visualizzazione usare imshow(f,'InitialMagnification','fit')
Visualizzazione dello spettro • Esercizio 2 • Creare un’immagine 30x30 con un rettangolo bianco su sfondo nero • Calcolare la DFT e visualizzare lo spettro di ampiezza (fft2) • Aggiungere dello zero padding per migliorare il calcolo della DFT • Shiftare la componente zero al centro dello spettro (fftshift) • Per migliorare la visualizzazione usare la funzione log • Suggerimento per la visualizzazione usare imshow(f,'InitialMagnification','fit')
Visualizzazione dello spettro (2) original DFT Zero-padded DFT Centered and Log
Relazione fra DFT e filtraggio nel dominio spaziale The following convolution theorem shows an interesting relationship between the spatial domain and frequency domain: and, conversely, the symbol "*" indicates convolution of the two functions. The important thing to extract out of this is that the multiplication of two Fourier transforms corresponds to the convolution of the associated functions in the spatial domain.
Correlazione MATLAB uses one of two methods, correlation or convolution, to filter various images. The two operations are identical except correlation rotates the filter matrix 180o before filtering, while convolution keeps it the same. The Fourier transform can also be used to perform correlatio. Correlation can be used to locate features within an image; in this context correlation is often called template matching.
Correlazione • Esercizio 3 • Caricare l’immagine text.png • Estrarre la lettera a dall’immagine e creare un template • Calcolare la correlazione C = ifft2(fft2(A).*fft2(B)); • Visualizzare la localizzazione nell’immagine della lettera a
Filtering Procedure in MatLab • For a M x N size image. • Determine the padded size P x Q needed (P = 2M and Q = 2N is the most common method) • Multiply image f(x,y) by (–1)(x+y) to get fc(x,y) • Zero pad fc(x,y) then take DFT to get FZP(u,v) in FD • Create centered H(u,v) filter function in FD of the proper padded size P x Q • Point by point multiply FZP(u,v) by H(u,v) • Take the inverse DFT of the result in (5) • Obtain real part of result in (6) • Crop filtered image from the UL corner of array • Multiply result in (8) by (–1)(x+y) • You now have a filtered image of the same size as the original image
Specific Frequency Domain Filters • As you have already seen, based on the property that multiplying the FFT of two functions from the spatial domain produces the convolution of those functions, you can use Fourier transforms as a fast convolution on large images. Note that on small images it is faster to work in the spatial domain. • However, you can also create filters directly in the frequency domain. There are three commonly discussed filters in the frequency domain: • Lowpass filters, sometimes known as smoothing filters • Highpass filters, sometimes known as sharpening filters • Notch filters, sometimes known as band-stop filters
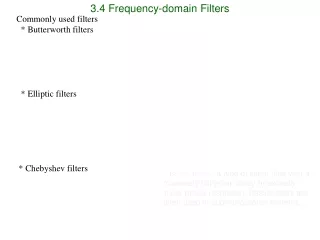
Low-Pass filters • Lowpass filters: • create a blurred (or smoothed) image • attenuate the high frequencies and leave the low frequencies of the Fourier transform relatively unchanged • Three main lowpass filters are discussed in Digital Image Processing Using MATLAB: • Ideal lowpass filter (ILPF) • Butterworth lowpass filter (BLPF) • Gaussian lowpass filter (GLPF)
Low-Pass filters function H = lpfilter(type, M, N, D0, n) %LPFILTER Computes frequency domain lowpass filters % H = LPFILTER(TYPE, M, N, D0, n) creates the transfer function of a lowpass filter, H, of the specified TYPE and size (M-by-N). To % view the filter as an image or mesh plot, it should be centered using H = fftshift(H). % Valid values for TYPE, D0, and n are: % 'ideal' Ideal lowpass filter with cutoff frequency D0. n need not be supplied. D0 must be positive % 'btw' Butterworth lowpass filter of order n, and cutoff D0. The default value for n is 1.0. D0 must be positive. % 'gaussian' Gaussian lowpass filter with cutoff (standard deviation) D0. n need not be supplied. D0 must be positive. % Use function dftuv to set up the meshgrid arrays needed for computing the required distances. [U, V] = dftuv(M, N); % Compute the distances D(U, V). D = sqrt(U.^2 + V.^2); % Begin fiter computations. switch type case 'ideal' H = double(D <=D0); case 'btw' if nargin == 4 n = 1; end H = 1./(1 + (D./D0).^(2*n)); case 'gaussian' H = exp(-(D.^2)./(2*(D0^2))); otherwise error('Unknown filter type.') end
Low-Pass filters • Ideal • HLPF_ideal=fftshift(lpfilter('ideal', 500, 500, 50)); 0 • mesh(HLPF_ideal(1:10:500,1:10:500)) • colormap([0 0 0]) • axis off • grid off • axis([0 50 0 50 0 1]) • figure, imshow(HLPF_ideal) • Butterworth • HLPF_btw=fftshift(lpfilter('btw', 500, 500, 50)); • figure, mesh(HLPF_btw(1:10:500,1:10:500)) • colormap([0 0 0]) • axis off • grid off • axis([0 50 0 50 0 1]) • figure, imshow(HLPF_btw) • Gaussian • HLPF_gauss=fftshift(lpfilter('gaussian', 500, 500, 50)); • figure, mesh(HLPF_gauss(1:10:500,1:10:500)) • colormap([0 0 0]) • axis off • grid off • axis([0 50 0 50 0 1]) • figure, imshow(HLPF_gauss)
Low-Pass filters • Esercizio 4 • Caricare e convertire in scala di grigi l’immagine football.jpg e visualizzarla • Calcolare il padding adeguato • Creare un filtro low-pass gaussiano • Calcolare la DFT • Applicare il filtro • Riconvertire al dominio spaziale • Tagliare l’immagine per riportarla alle dimensioni originali • Visualizzare l’immagine e lo spettro
High-Pass filters function H = hpfilter(type, M, N, D0, n) %HPFILTER Computes frequency domain highpass filters % H = HPFILTER(TYPE, M, N, D0, n) creates the transfer function of % a highpass filter, H, of the specified TYPE and size (M-by-N). % Valid values for TYPE, D0, and n are: % 'ideal' Ideal highpass filter with cutoff frequency D0. n % need not be supplied. D0 must be positive % 'btw' Butterworth highpass filter of order n, and cutoff D0. % The default value for n is 1.0. D0 must be positive. % 'gaussian' Gaussian highpass filter with cutoff (standard deviation) % D0. n need not be supplied. D0 must be positive. % The transfer function Hhp of a highpass filter is 1 - Hlp, % where Hlp is the transfer function of the corresponding lowpass % filter. Thus, we can use function lpfilter to generate highpass % filters. if nargin == 4 n = 1; % Default value of n. end % Generate highpass filter. Hlp = lpfilter(type, M, N, D0, n); H = 1 - Hlp;
High-Pass filters • Ideal • HHPF_ideal=fftshift(hpfilter('ideal', 500, 500, 50)); • mesh(HHPF_ideal(1:10:500,1:10:500)) • colormap([0 0 0]) • axis off • grid off • axis([0 50 0 50 0 1]) • figure, imshow(HHPF_ideal) • Butterworth • HHPF_btw=fftshift(hpfilter('btw', 500, 500, 50)); • figure, mesh(HHPF_btw(1:10:500,1:10:500)) • colormap([0 0 0]) • axis off • grid off • axis([0 50 0 50 0 1]) • figure, imshow(HHPF_btw) • Gaussian • HHPF_gauss=fftshift(hpfilter('gaussian', 500, 500, 50)); • figure, mesh(HHPF_gauss(1:10:500,1:10:500)) • colormap([0 0 0]) • axis off • grid off • axis([0 50 0 50 0 1]) • figure, imshow(HHPF_gauss)
High-Pass filters Esercizio 5 • Caricare e convertire in scala di grigi l’immagine football.jpg e visualizzarla • Calcolare il padding adeguato • Creare un filtro high-pass gaussiano • Calcolare la DFT • Applicare il filtro • Riconvertire al dominio spaziale • Tagliare l’immagine per riportarla alle dimensioni originali • Visualizzare l’immagine e lo spettro
Aliasing and Interpolation Esercizio 5 • Caricare l’immagine Barbara.tif • Portarla ad ¼ della dimensione originale • Ripristinare la dimensione originale • Usare un filtro anti-aliasing per ridurre gli artefatti • confrontare i risultati