Download
1 / 48
480 likes | 729 Views
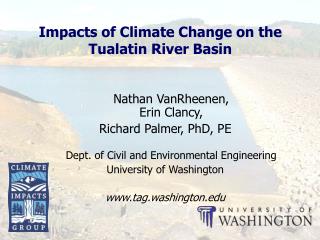
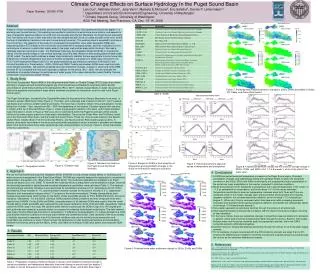
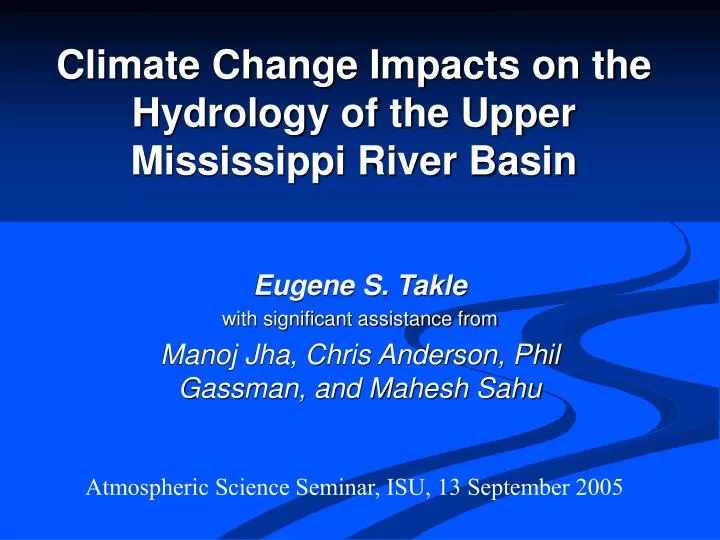
Climate Change Impacts on the Hydrology of the Upper Mississippi River Basin. Eugene S. Takle with significant assistance from Manoj Jha, Chris Anderson, Phil Gassman, and Mahesh Sahu. Atmospheric Science Seminar, ISU, 13 September 2005.

E N D
Climate Change Impacts on the Hydrology of the Upper Mississippi River Basin Eugene S. Takle with significant assistance from Manoj Jha, Chris Anderson, Phil Gassman, and Mahesh Sahu Atmospheric Science Seminar, ISU, 13 September 2005
If we had perfect predictability of low-resolution global climate fields, how well can we downscale this predictability to stream flow at one point?
Outline • Upper Mississippi River Basin • Soil and Water Assessment Tool (SWAT) • Climate information • Observations • Contemporary climate • Future climate • Flow simulations • Water quality • Summary
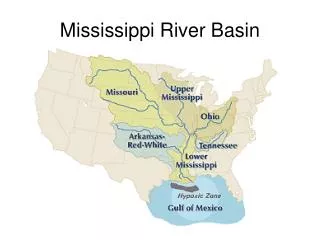
Sub-Basins of the Upper Mississippi River Basin 119 sub-basins Outflow measured at Grafton, IL Approximately one observing station per sub-basin Approximately one model grid point per sub-basin
Soil Water Assessment Tool (SWAT) • Long-term, continuous watershed simulation model (Arnold et al,1998) • Daily time steps • Assesses impacts of climate and land management on yields of water, sediment, and agricultural chemicals • Physically based, including hydrology, soil temperature, plant growth, nutrients, pesticides and land management
Calibration of SWAT: Annual Stream Flow at Grafton, IL
Calibration of SWAT: Monthly Stream Flow at Grafton, IL
Validation of SWAT: Annual Stream Flow at Grafton, IL
Validation of SWAT: Monthly Stream Flow at Grafton, IL
Downscaling Methods • Dynamical downscaling (use GCM to provide b.c. for RCM) • Statistical or empirical transfer functions to relate local climate to GCM output • Climate analog procedures • Combinations of statistical and dynamical methods
Downscaling For applications of global climate model results to hydrology, there is a significant mismatch between the spatial scales of the model resolution and features of drainage basins. Approximate locations of points for a 2.5o x 2.5o global model grid
RegCM2 Simulation Domain Red = global model grid point Green/blue = regional model grid points
SWAT Output with Various Sources of Climate Input
Annual Stream Flow Simulated by SWAT Driven by the RegCM2 Regional Climate Model with NNR Lateral Boundary Conditions
Seasonal Stream Flow Simulated by SWAT Driven by the RegCM2 Regional Climate Model with NNR Lateral Boundary Conditions
Mean Monthly Precipitation Simulated by the RegCM2 Regional Climate Model with NNR Lateral Boundary Conditions
Hydrological component comparison • between RegCM2 and SWAT Note: All values are in mm per year averaged for 1980-1988 in NNR run.
Ten-Year Mean Precipitation Generated by the RegCM2 Regional Climate Model Driven with HadCM2 Global Model Results for the Contemporary and Future Scenario (2040s) Climate
Ten-Year Mean Monthly Stream Flow Generated by the RegCM2 Regional Climate Model Driven with HadCM2 Global Model Results for the Contemporary and Future Scenario (2040s) Climate
Hydrologic Budget Components Simulated by SWAT under Different Climates All units are mm Yield is sum of surface runoff, lateral flow, and groundwater flow
Relation of Runoff to Precipitation for Various Climates
Summary of RCM Studies • RCM provides meteorological detail needed by SWAT to resolve sub-basin variability of importance to streamflow • There is strong suggestion that climate change introduces changes of magnitudes larger than variation introduced by the modeling process • Relationship of streamflow to precipitation might change in future scenario climates
Alternative to Dynamical Downscaling Global Model Results • Linear interpolation of GCM results • Spatial disaggregation • Bias corrected spatial disaggregation “…a de facto minimum standard of any useful downscaling method for hydrologic applications: the historic (observed) conditions must be reproducible.” Wood, et al., 2004: Climatic Change 62:189 Note: These methods could be applied to downscaled (RCM) results as well.
Hypothesis: Simple linear interpolation of global climate model results as input to SWAT is incapable of reproducing historical (observed) hydrological conditions in the Upper Mississippi River Basin
Simulation of Streamflow by 9 Global Models and Model Ensemble
P-values of T-test of individual GCM/SWAT streamflow and pooled GCM/SWAT streamflow (labeled as GCM POOL) compared to OBS/SWAT
Hypothesis: Simple linear interpolation of global climate model results as input to SWAT is incapable of reproducing historical (observed) hydrological conditions in the Upper Mississippi River Basin Results: Hypothesis is true for individual models (except MIROC-hires) Hypothesis is false for MIROC-hires Hypothesis is false for the ensemble of GCMs
Table 4. Results for the multi-model ensemble mean of SWAT driven by GCMs and observed meteorological conditions for sub-periods of the 20C. Results for the multi-model ensemble mean of SWAT driven by GCMs and observed meteorological conditions for sub-periods of the 20C • Note: Percent differences are calculated from measured data when available and otherwise from results of SWAT driven by observed meteorology. Different averaging periods were used as follows: OBS/SWAT: 1968-1997; GCM/SWAT: 1963-2000; MIROC3.2 (hires)/SWAT: 1963-2000; and HadCM2/RegCM2/SWAT: 1990-1999. Results in the last two columns are from Jha et al. (2004).
Model biases and climate change for each hydrological cycle component (2082-2099)
Model biases and climate change for each hydrological cycle component (2082-2099)
Model biases and climate change for each hydrological cycle component (2082-2099)
Model biases and climate change for each hydrological cycle component (2082-2099)
Preliminary Interpretation • Models consistently under-estimate ET and PET (likely due to coarse resolution) • Low ET forces more water to baseflow • High baseflow increases total water yield • Hence I assert that low-resolution models over-predict streamflow because they are incapable of resolving high daily max temps that have a disproportionate influence on ET
Current Work • Look at more global models • Look at ensembles of individual models • Look at the low, medium, and high-resolution results for MIROC • Extend SWAT to better simulate sub-surface effects of riparian buffer strips (Mahesh Sahu)
Application of SWAT model to simulate riparian buffer zone Mahesh Sahu, Graduate Research Assistant CCEE
Crop Crop Buffer Strip Buffer Strip River River Hill Slope scheme Present Scheme in Swat for riparian buffer simulation Conventional SWAT: Present Mahesh Sahu, Graduate Research Assistant CCEE
Flows simulated in SWATExisting Hill slope option & its limitations Switch grass Corn Q surface Q lateral Q GW The existing hill slope option has the capability to incorporate the surface flow from the crop area through the buffer zone area. Lateral and groundwater flow links are NOT present in the existing hill slope scheme. Mahesh Sahu, Graduate Research Assistant CCEE
Future Directions • Couple GCM, RCM, SWAT, Crop Model and Economic Model • Evaluate policy alternatives: • Impact of introducing conservation practices • Impact of introducing incentives • Hypothesis: It is possible to balance profitability with sustainability in an intensively managed agricultural area under changing climate through development of robust policy
GCM OBS RCM Crop Model NNR Climate Over UMRB Crop Yield SWAT Economic Model Soil Drainage Land-use Management Choices OBS Incentives Stream flow Soil Carbon Crop Production Water Quality Public Policy Evaluate Sustainability and Profitability
Summary • Changes to the hydrological cycle associated with climate change are of high societal importance • Dynamical downscaling of global model results by a regional model gives 20% increase in precipitation in the basin and 50% increase in streamflow
Summary • Linear interpolations of individual low-resolution GCMs are incapable of simulating historical streamflows in the UMRB • Linear interpolation of a high-resolution global model is capable of simulating historical streamflows in the UMRB • An ensemble of linear interpolations of individual low-resolution GCMs is capable of simulating historical streamflows in the UMRB