Download

1 / 24
250 likes | 472 Views
CLIMATE CHANGE IMPACTS ON THE HYDROLOGY OF THE UPPER MISSISSIPPI RIVER BASIN AS DETERMINED BY AN ENSEMBLE OF GCMS. Eugene S. Takle 1 , Manoj Jha, 1 Christopher J. Anderson 2 , and Philip W. Gassman 1 1 Iowa State University, Ames, IA

E N D
CLIMATE CHANGE IMPACTS ON THE HYDROLOGY OF THE UPPER MISSISSIPPI RIVER BASIN AS DETERMINED BY AN ENSEMBLE OF GCMS Eugene S. Takle1, Manoj Jha,1 Christopher J. Anderson2, and Philip W. Gassman1 1Iowa State University, Ames, IA 2NOAA Earth System Research Laboratory Global Systems Division Forecast Research Branch, NOAA/ESRL/GSD/FRB, Boulder, CO gstakle@iastate.edu
Research Question • Previous research has shown • An acceleration of the hydrological cycle • Increased occurrence of extreme precipitation events in the US Midwest • The Mississippi River is vital to the health and economy of the Midwest. How will streamflow and hydrologic components in the Upper Mississippi River Basin change in the future?
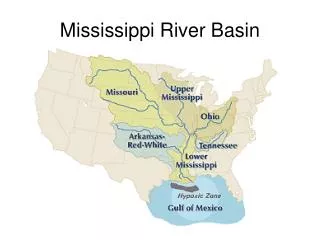
Sub-Basins of the Upper Mississippi River Basin 119 sub-basins 474 hydrological response units Outflow measured at Grafton, IL Approximately one observing station per sub-basin
Soil Water Assessment Tool (SWAT) • Long-term, continuous watershed simulation model (Arnold et al,1998) • Daily time steps • Assesses impacts of climate and management on yields of water, sediment, and agricultural chemicals • Physically based, including hydrology, soil temperature, plant growth, nutrients, pesticides and land management
Simulation of 20th C Streamflow • Period 1961-2000 (Streamflow observations are available) • Use 9 GCMs from the IPCC AR4 Data Archive We acknowledge the international modeling groups for providing their data for analysis, the Program for Climate Model Diagnosis and Intercomparison (PCMDI) for collecting and archiving the model data, the JSC/CLIVAR Working Group on Coupled Modeling (WGCM) and their Coupled Model Intercomparison Project (CMIP) and Climate Simulation Panel for organizing the model data analysis activity, and the IPCC WG1 TSU for technical support. The IPCC Data Archive at Lawrence Livermore National Laboratory is supported by the Office of Science, US Department of Energy
UMR Streamflow Measured at Grafton (Gage) and Simulated with Observed Precipitation (Obs) and Precipitation Generated by GCMs
UMR Streamflow Measured at Grafton (Gage) and Simulated with Observed Precipitation (Obs) and Precipitation Generated by GCMs
UMR Streamflow Measured at Grafton (Gage) and Simulated with Observed Precipitation (Obs) and Precipitation Generated by GCMs
UMR Streamflow Measured at Grafton (Gage) and Simulated with Observed Precipitation (Obs) and Precipitation Generated by GCMs Model Mean
Results of Statistical Analysis • all GCMs are serially uncorrelated at all lags and form unimodal distributions • the data may be modeled as independent samples from an identical normal distribution rather than as time series • all pair-wise comparisons except MIROC3.2(hires)/SWAT could be rejected at the 2% or higher level • The T-test for the MIROC3.2(hires) had a p-value of 0.8312, p-value for MIROC3.2(medres) was 4.1x10⁻⁵ • Conclusion: high resolution improves simulation of UMRB streamflow
Ensemble of GCMs • Individual time series of GCM/SWAT annual streamflow are uncorrelated to one another • We may hypothesize that there is a population from which all GCM/SWAT results represent independent samples • Test of the hypothesis of zero difference between mean annual streamflow of the pooled GCM/SWAT and OBS/SWAT results gives a p-value of 0.5979 • Conclusion: use of GCM output to form an ensemble of streamflow results may provide a valid approach for assessing annual streamflow in the UMRB
Hydrological Components Simulated by SWAT Takle, E. S., M. Jha, and C. J. Anderson, 2005: Hydrological cycle in the Upper Mississippi River Basin: 20th century simulations by multiple GCMs. Geophys. Res. Lett., 32, L18407 10.1029/2005GL023630 (28 September)
Hydrologic Components Simulated by SWAT Driven by GCMs and GCM/RCM for 20C Jha, M., Z. Pan, E. S. Takle, R. Gu, 2004:. J. Geophys. Res. 109, D09105, doi:10.1029/2003JD003686
Results for 20C Simulations • Use of a GCM drawn at random to drive SWAT could lead to sizable errors in streamflow and hydrological cycle components • Use of the meteorological conditions from an ensemble of GCM/SWAT simulations, by contrast, performs quite well • The lone high-resolution GCM does as well as the ensemble mean despite large errors in its lower-resolution sister model • Global model results downscaled by a regional model (models chosen on the basis of availability) used to drive SWAT are inferior to those resulting from the GCM model mean and the high-resolution GCM
See Extended Abstract for summary of hydrologic component biases (20C) and changes for 21st C as simulated by SWAT
Biases in Hydrologic Components • GCMs underestimate annual precipitation by a modest amount, but overestimate streamflow • Most models produce too much snow • Models are inconsistent regarding the amount of runoff • Baseflow is uniformly high • PET and ET are uniformly low by 25 - 38% • Total water yield is overestimated by all but one model • Deficiency in ET forces a model to partition more soil water input to baseflow, which explains uniformly excessive baseflow and hence streamflow because baseflow is the dominant contributor to total water yield • Streamflow is over-predicted in this basin by global models because of failure to resolve daily maximum temperatures in summer due to coarse resolution
21st Century Climate Simulations • Results from 7 models were available at the time of analysis • GFDL-CM 2.0 • MIROC 3.2 (medres) • MIROC 3.2 (hires) • MRI • GISS-AOM • BIS_ER • IPSL-CM 4.0 • Period 2082-2099
Simulated Climate Change • Although there is inconsistency among models, the mean precipitation created by the ensemble suggests an increase of 6% due to climate change. • Changes in ET and PET are positive for all models, with more uniformity in ET. These changes likely result from temperature increases in the warm season. • Substantial decreases in snowfall suggest that warming is strong in winter. • Runoff decreases substantially for most models, possibly due to enhanced drying of soils (due to enhance ET) between rains, which then can hold more precipitation when the next event occurs. • Total water yield shows wide variance among the models, with the ensemble mean showing almost no change from the contemporary climate.
Conclusions • Use of a single low-resolution GCM for assessing impact of climate change on hydrology of the UMRB carries the possibility of high bias • High-resolution GCM might have substantially reduced biases (except for ET) • Ensemble of GCMs reproduces observed 20C streamflow of UMRB quite well • GCM/RCM has biases comparable to GCM • Simulated climate change includes 6% increase in precipitation, increase in ET, decrease in snowfall, decrease in runoff and essentially no change in streamflow
Acknowledgement We acknowledge the international modeling groups for providing their data for analysis, the Program for Climate Model Diagnosis and Intercomparison (PCMDI) for collecting and archiving the model data, the JSC/CLIVAR Working Group on Coupled Modeling (WGCM) and their Coupled Model Intercomparison Project (CMIP) and Climate Simulation Panel for organizing the model data analysis activity, and the IPCC WG1 TSU for technical support. The IPCC Data Archive at Lawrence Livermore National Laboratory is supported by the Office of Science, US Department of Energy