Download
1 / 24
240 likes | 330 Views
GIS Applications and Preparing for a Career in Geographic Information Science. Michael Wing Assistant Professor OSU Forest Engineering Department. Presentation Topics. Summary of two recently completed GIS applications that focused on forested resources in Oregon

E N D
GIS Applications and Preparing for a Career in Geographic Information Science Michael Wing Assistant Professor OSU Forest Engineering Department
Presentation Topics • Summary of two recently completed GIS applications that focused on forested resources in Oregon • Suggestions for your development as a geographic information scientist
Using Geostatistics to Quantify LWD Distribution • Examined geostatistical tests for their usefulness in quantifying LWD distributions • Part of a study to test the effects of adding LWD to streams • LWD is critical for aquatic habitat quality • Hudson Creek in Oregon’s southern coast range • Locations of all LWD measured prior and following introduction of LWD into a stream
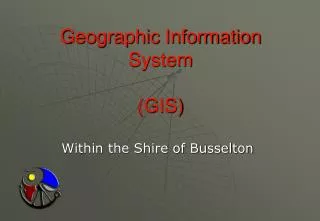
F l o w # # # # # # # # # N # # # # 0 5 1 0 M e t e r s Figure 1. Examples of data models used in geostatistical analyses. Points Points with volumes Volume by surface
Figure 2. Semi-variance of large woody debris centroid volumes.
Figure 3. Semi-variance of large woody debris lattice volumes
Results • All three tests captured differences in spatial variation over time • geostatistics show potential for use as a descriptive tool • Third data model using a semi-variogram provided the most useful results • modeled the entire surface of the stream • captured increased spatial variation of LWD
Role of GIS for LWD Project • Allowed us to create three different data models: • point • point with LWD volume • entire stream surface area by LWD volume (regions data model) • Enabled two spatial statistical tests using three data models • flexibility in formatting data for statistical tests
Visibility Analysis ofMcDonald Forest • Part of OSU’s research forests (29 km2) • Quantify visibility of all forest area based on detailed user counts • Create a map for the entire forest that representsing visibility
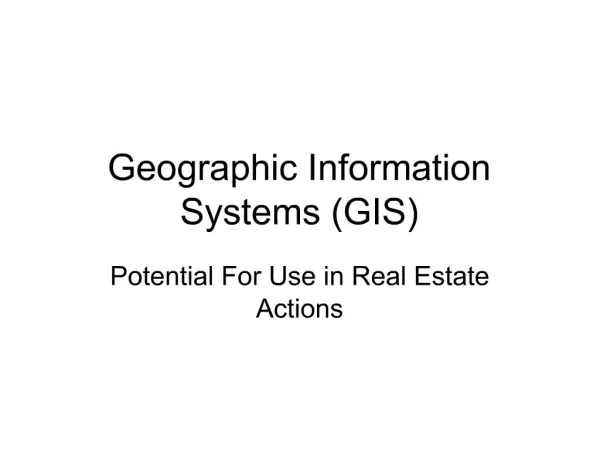
B o u n d a r y U s e E s t i m a t e s ( q u a n t i l e d i s t r i b u t i o n ) 2 7 - 2 1 3 2 1 8 - 6 2 8 6 5 3 - 1 , 3 2 1 1 , 3 2 3 - 3 , 3 9 4 3 , 4 3 7 - 2 1 , 6 2 0 0 1 2 M i l e s Total use estimates for McDonald Forest Roads: 104 km Trails: 40 km Approximately 65,000 recreational visits in 1994.
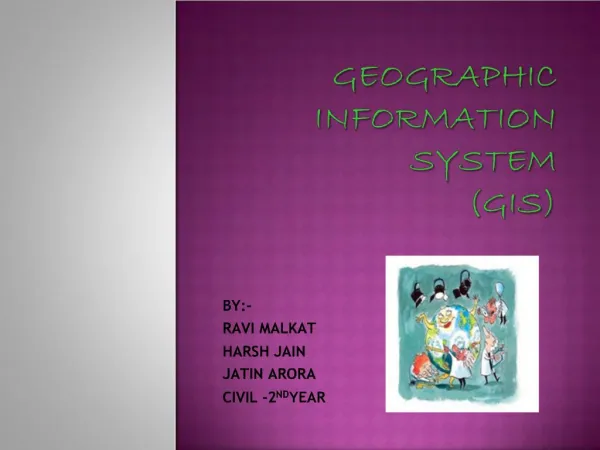
Data Inputs • DEM (10 meter resolution) • Stand height • Road and trail locations • user densities for each road and trail • Observer height, view distance radius, vertical offset Data Output • Results in quantifying visibility for each 10 m cell in the forest • Raster or vector data structure can be returned
M c D o n a l d F o r e s t V i s i b i l i t y R e s u l t s F o r e s t b o u n d a r y R o a d s a n d t r a i l s V i s i b i l i t y ( n u m b e r o f p e o p l e ) 0 1 - 1 0 1 8 7 1 0 1 8 8 - 2 8 8 5 1 2 8 8 5 2 - 5 4 6 0 0 5 4 6 0 3 - 2 1 9 2 7 0
P e a v y V i s i b i l i t y R e s u l t s N u m b e r o f u s e r s 2 7 - 2 7 1 2 7 8 - 9 2 6 9 5 1 - 2 9 4 4 2 9 7 3 - 2 1 6 2 0 F o r e s t b o u n d a r y V i s i b i l i t y ( n u m b e r o f p e o p l e ) 0 1 - 1 0 1 8 7 1 0 1 8 8 - 2 8 8 5 1 2 8 8 5 2 - 5 4 6 0 0 5 4 6 0 3 - 2 1 9 2 7 0
Role of GIS- Visibility Analysis • Processed visibility algorithm • Manipulated data inputs • No need for other software • Project nearly impossible without GIS • about 250 road and trail segments • ability of GIS to automate processing helped avoid errors
Opportunities using spatial tools • Scientist • Charting research direction • Interpreting and publishing research results • Analyst • Working with scientists to understand project goals • Statistical analysis • Database organization • Technician • Conducting spatial processing tasks • Preparing output
Local GIS jobs in Jan./Feb • Corvallis, GIS Specialist- GS 9/11 (USFS PNWR) • Corvallis, GIS Intern- $10-12/ hr, part time to start (E&S Environmental Chemistry) • Corvallis, Photo Interpreter and GIS specialist- $12-$16/hr, part time to start • Salem, GIS Analyst II- $3,100 to $4,064 month (City of Salem) • Roseburg, GIS Assistant- $12/hr, 34 weeks (Fed. Agency)
Professional involvement… • ACSM, ASPRS, AGU, SAF, Hydrophiles • OSU ASPRS winter term meetings • ArcInfo developments • Focus on NT (Windows 2000) rather than UNIX • DOQs (1 m resolution is complete) • SSCGIS resurrected for the next biennium
Your professional development • Focus your education on a discipline • Geology, hydrology, forestry, biometrics, oceanography, fish & wildlife • Make spatial tools a supporting discipline • Become familiar with many software packages and know their uses/limitations • S-Plus, SAS • Access, DBase, Excel • ArcInfo (GRID), ArcView (SA, 3D), MapInfo • Imagine, IDRISI
Your professional development • Familiarity with data structures • Vector, raster, TINs, regions • Familiarity with data sources • DOQs, DRGs, DEMs, DLGs, Imagery, SSCGIS data themes • Scale/resolution of these sources is a defining factor of their utility • Statistics • A key for many disciplines
Data utility • All data are abstractions of the real world • Error sources abound and confound • Collection errors • Input errors • Date of collection, updates • USGS 7.5 minute quads are typically over 20 years old • Scale/resolution • Data collection purpose
Don’t wait for data… • Precious time is wasted anticipating data arrival • Data completion/arrival schedules are always overly optimistic • Complete doesn’t mean available • 10 m DEMs for Oregon’s westside are complete • Concentrate research efforts on available data
Your role with spatial tools • Cartographer • Geographer (M. Jordan and A. Einstein) • Statistician • Data accumulator / administrator • Data processor • Network administrator • The pinnacle: Spatial Scientist • Appreciate, integrate, and delegate the above skills and disciplines into your research efforts
Future Trends in GIS • Increased use and growth in most disciplines • GIS and remote sensing technology have evolved to become the single most significant tools for natural resource research and mgmt. • Data will continue to be produced at finer resolution • The future appears to be modular • Windows NT (Windows 2000) based • Period of user dominance will continue • easier to use, easier to get in trouble


![Geographic Information System [GIS]](https://cdn2.slideserve.com/5315378/geographic-information-system-gis-dt.jpg)