Download
1 / 50
510 likes | 644 Views
GIS GEOGRAPHIC INFORMATION SYSTEMS AND GEOMAPPING. Panel Discussion ICECON, 2007 November 1-4, Pittsburg, Pa. Where Did GIS Come From?. GIS is built upon knowledge from geography, cartography, computer science and mathematics.

E N D
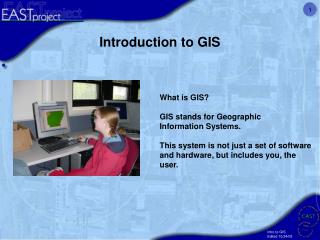
GIS GEOGRAPHIC INFORMATION SYSTEMS AND GEOMAPPING Panel Discussion ICECON, 2007 November 1-4, Pittsburg, Pa.
Where Did GIS Come From? • GIS is built upon knowledge from geography, cartography, computer science and mathematics. • Geographic Information Science is a new interdisciplinary field built out of the use and theory of GIS.
Definition 1: A GIS is a toolbox "a powerful set of tools for storing and retrieving at will, transforming and displaying spatial data from the real world for a particular set of purposes" (Burrough, 1986, p. 6). "automated systems for the capture, storage, retrieval, analysis, and display of spatial data." (Clarke, 1995, p. 13).
Definition 2: Duecker's 1979 definition has survived the test of time. "A geographic information system is a special case of information systems where the database consists of observations on spatially distributed features, activities or events, which are definable in space as points, lines, or areas. A geographic information system manipulates data about these points, lines, and areas to retrieve data for ad hoc queries and analyses" (Duecker, 1979, p 106).
Duecker (ctd) • A GIS is flexible enough to be used for ad hoc query and analysis. • A GIS can do analysis, modeling and prediction.
The Feature Model • Duecker's definition uses the feature model of geographic space. • The standard feature model divides a mapped landscape up into features, that can be points, lines, or areas. • Using a GIS involves capturing the spatial distribution of features by measurement of the world or of maps. • Almost all human activity and natural phenomena are spatially distributed, so can be studied using a GIS. • A GIS uses map features to manage data.
Definition 3: GIS is an approach to science • Geographic Information Science is research both on and with GIS. "the generic issues that surround the use of GIS technology, impede its successful implementation, or emerge from an understanding of its potential capabilities." (Goodchild, 1992)
Definition 4: GIS is a multi-million dollar business. “The growth of GIS has been a marketing phenomenon of amazing breadth and depth and will remain so for many years to come. Clearly, GIS will integrate its way into our everyday life to such an extent that it will soon be impossible to imagine how we functioned before”
A Brief History of GIS • GIS’s origins lie in thematic cartography. • Many planners used the method of map overlay using manual techniques. • Manual map overlay as a method was first described comprehensively by Jacqueline Tyrwhitt in a 1950 planning textbook. • HcHarg used blacked out transparent overlays for site selection in Design with Nature.
Land Fragmentation • Population Changes & Urban Sprawl • Re-Pioneering of Rural Areas • Water • Energy issues • Demand for “Ecosystem Services”
Usefor Business to... • Plan advertising and media schedules • Analyze market penetration • Check on the competition • Use demographics to rank new locations • And much more!
Market-Based Business Problems • Where are my customers? • What is my market area? • Do I have more than one store serving the same group of customers? • What percentage of my customers account for X% of a store’s sales? • Area of influence?
Create Market Areas Based on Number of Customer or Customer Sales
Analyze Your Market Penetration See How Well You Are Reaching Your Market Areas
VisualizeCustomerDraw See Where Your Customers Live and Which of Your Stores They Shop
Customer-Based Business Problems • What is the profile of my existing customers? • Where can I find more customers like my best customers? • Where should I target direct mail to get the most ROI for my marketing dollars? • Where is the best place for my new facility?
To Find More Customers Like Your Best Customers... Start by Profiling Your Customer Base
Block Groups in Blue Indicate Areas that Match the Profile of Your Best Customers Then Identify Geographic Areas Match the Profile of Your Best Customers
Precision-Tune Target Marketing and get a better ROI on your direct mail dollars
Site-Based Business Problems • Where are my stores? • What is the surrounding demographic profile? • Where are my customers? • Where are my competitors? • Which stores are the most successful? • What are the dynamics/characteristics of these stores?
0-2 2-4 4-6 Analyze Market Demographics Is Your Site Near Your Ideal Customers?
Analyze Store Performance and Visualize Customer Draw Poor Performing Stores Could Be a Result of Cannibalization
Analyze Site Demographics Identify your demographic drivers to help you find similar sites
Analyze Your Competition Find out how consumer spending, competition, and distance affect the attractiveness of your new location
More Site-Based Business Problems • Where are high potential areas? • What are the characteristics/dynamics of potential sites? • What impact would this site have on other existing sites, and vice versa? • Can I consolidate sites without hurting customer service?
Evaluate sites based on proximity to preferred demographic areas Compare Multiple New Sites Viewing and Analyzing Demographics
Analyze Existing Sites and Identify the Competition in the Area
Analyze Prospective Sites Using Drive Time Modeling How Close Are Your Customers to the Site?
Other Business Tasks • Marketing campaigns • Where is my target market?...By product/service? • What type of media would best reach these consumers? • Expansion, Consolidation, and Mergers • What effect would opening/closing a facility have on the market? • Where are areas of significant cannibalization?
Other Business Tasks • Product planning • Which products are doing well? • Which products should do well given the surrounding demographics? • Which products should be promoted based on lifestyles and demographics? • Which products and how much should be stocked at each site?
Multi-Disciplinary • GIS allows for the efficient analysis. • It increases our ability to solve problems. • As well as, increases our understanding of the complexity of systems.
Precision Ag - Corn Ohio – Nathan Watermeier
Invasive Species Monitoring and Management Invasive Conifers – Texas, New Mexico and Montana
Urban Forest Inventories Texas A&M Campus Tree Inventory- location of all trees on campus included in GIS- attributes of each tree stored in database: - species - DBH - disease status - pruning schedules - etc. used for the day-to-day management of the Texas A&M urban forest
Drought and Irrigation Planning UTAH – Dr. Phil Rassmusen
Urban Flood Damage Assessment and Mitigation Economic analysis was used to compare estimated property losses to flood control investments Blue areas depict flooded areas.
Farm & Ranch Land 143.9 Million acres83.7% of the State
Loss of Farm & Ranch Land, 2000-2003 Metro Areas Lost 1.44 Million acres in 3 Years
Flood Modeling and Damage Assessment Using GIS Structure Inventory Perspective view of 500 yr Flood event
Discussion Questions • What is the take-away for a business student utilizing GIS? • Where/why does GIS fit into the IS/MIS curriculum? • Is it important to incoporate GIS in the IS standard? • I what area of the 8 core competencies would GIS apply? • What is the next step?
Web Resources • http://www.esri.com/ • http://www.esri.com/ • http://www.esri.com/industries/university/index.html • Resources • http://www.tnris.state.tx.us/