Download
1 / 12
140 likes | 267 Views
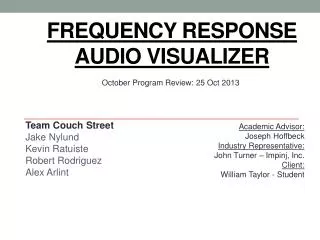
Frequency Response Audio Visualizer. Team Couch Street Jake Nylund Kevin Ratuiste Robert Rodriguez Alex Arlint. Academic Advisor: Dr. Joseph Hoffbeck Industry Representative: John Turner – Impinj , Inc. Clients: William Taylor - Student. Overview. Team Introduction

E N D
Frequency Response Audio Visualizer Team Couch Street Jake Nylund Kevin Ratuiste Robert Rodriguez Alex Arlint Academic Advisor: Dr. Joseph Hoffbeck Industry Representative: John Turner – Impinj, Inc. Clients: William Taylor - Student
Overview • Team Introduction • Project Background • System Block Diagram • Design Challenges/Risks • Important Decisions • Milestones Overview
Team Introduction • Alex Arlint– Electrical engineer with 2 summers experience at LLNL, programming in MATLAB and working on laser systems. Aptitude in MATLAB will be useful for potential programming of micro-controllers. • Kevin Ratuiste – Electrical engineer with summer experience at Uniwest working with eddy current instruments. Soldering and VLSI chip design knowledge. Spring team lead. • Jake Nylund– Computer Engineer currently working in the IT department of a steel manufacturing company. Experience with hardware and software. Website administrator and Fall team lead. • Robert Rodriguez – Computer Engineer currently working for the University of Portland. Experience with audio signal and sound equipment. Website administrator.
Project Background • Sound visualizer using ferromagnetic fluid • Liquid that becomes magnetized in the presence of a magnetic field • Idea is to break the frequencies of an audio file into low-range, mid-range, and high-range • Separate ferrofluid container made of plexiglass for each frequency range • Idea for this project came from two team members’ proposals: • Work with ferrofluid • Work with sound to process audio input http://www.youtube.com/watch?v=6hLeKBNHBk4.
Design Challenges/Risks • Ferrofluid may react differently than we expect • Experiment extensively with the fluid to adequately characterize its behavior • Obtaining a power supply that can supply the amount of power needed and designing a circuit to control that power • Have yet to determine a solution • Certain hardware components may be difficult to construct • We plan to consult the various faculty members to overcome this potential future setback
Important Decisions • Testing the ferrofluid and characterizing its behavior • Key to the success of the project • Allows us to determine how to best manipulate the fluid to achieve desired results • Only building one display to begin with • If there is an issue, it will only be in 1 display instead of all 3 • Once the single display functions well in testing, the remaining 2 will be constructed
Milestones Overview • First Draft of Functional Specifications Document: 9/20/2013 • Adviser Approved Draft of Functional Specifications Document: 9/27/2013 • * Final Draft of Functional Specifications Document: 10/4/2013 • * Complete Testing of Ferromagnetic Fluid & Electromagnets: 10/13/2013 • Determine Filters for Signal Processing: 10/20/2013 • * Finalize Design Layout and Specifications: 10/27/2013 • First Draft of Design Document: 11/1/2013 • Adviser Approved Draft of Design Document: 11/8/2013 • * Final Draft of Design Document and Final Budget: 11/15/2013 • Order All Parts: 12/1/2013 • Finish Building Base and Get Audio Input: 1/17/2014 • ** Finish Building One Ferromagnetic Fluid Display: 1/24/2014 • ** Finish the Digital Signal Processor Controls: 1/31/2014 • * Testing and Debugging / One Fully Operational Display: 2/7/2014
Milestones Overview Cont. • Build Second and Third Displays: 2/21/2014 • Add Signal Processing for Two More Filters: 2/28/2014 • * Final Assembly Testing: 3/14/2014 • First Draft of Final Report: 3/21/2014 • Adviser Approved Draft of Final Report: 3/28/2014 • * Final Draft of Final Report: 4/4/2014 • * Founder Day Presentation: 4/8/2014 • Presentation of the Ferromagnetic Fluid Visualizer to the School of Engineering.
Summary • Team Introduction • Project Background • System Block Diagram • Design Challenges/Risks • Important Decisions • Milestones Overview