Download
1 / 31
310 likes | 321 Views
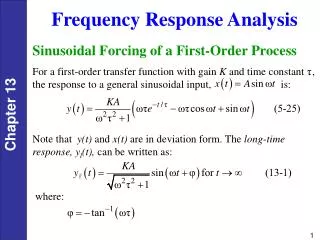
Frequency response:. Let. Then. and. Therefore;. +. Overall db gain =sum of individual db gains. +. =. +. Overall phase =sum of individual phases. +. =. Bode plot. Plot of db magnitude vs. Log frequency. Plot of phase vs. Log frequency. Bode Diagram. Magnitude (dB).

E N D
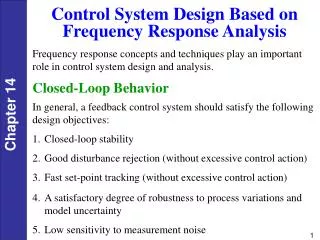
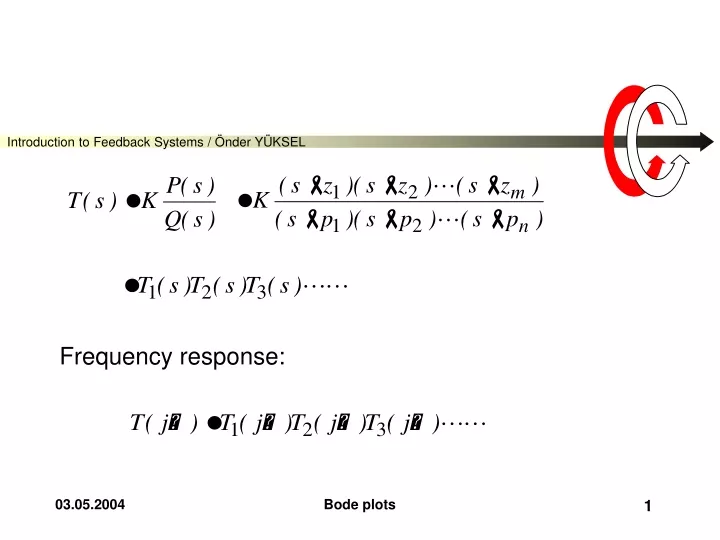
Frequency response: Bode plots
Let Then and Bode plots
Therefore; Bode plots
+ Overall db gain =sum of individual db gains + = Bode plots
+ Overall phase =sum of individual phases + = Bode plots
Bode plot Plot of db magnitude vs. Log frequency Plot of phase vs. Log frequency Bode plots
Bode Diagram Magnitude (dB) Phase (deg) -1 0 1 2 10 10 10 10 Frequency (rad/sec) Semi-log paper 1 decade 1 octave Bode plots
Procedure • Factorize the transfer function in to “simple” factors • Obtain magnitude(db) versus frequency and phase versus frequency characteristics for each • Obtain overall magnitude(db) versus frequency characteristics by adding those of factors • Obtain overall phase versus frequency characteristics by adding those of factors Bode plots
Constant multiplier Origin zero Origin pole Finite real zero Finite real pole Conjugate zero pair Conjugate pole pair “simple” factors Bode plots
Constant multiplier K 20logK Bode plots
w log Origin zero: s =1 Slope = 20 db/decade Bode plots
w log Origin pole: =1 Slope = -20 db/decade Bode plots
Finite real zero As As Bode plots
Asymptotes Bode plots
Deviations from actual 1 octave 1 db 1 db 3 db 1 octave Bode plots
=10z =z =z/10 Finite real zero:Phase vs. Frequency 1 decade 1 decade Bode plots
=z 0 1 decade 1 decade 0.1 rad 0.1 rad Bode plots
Finite real pole Bode plots
1 db 3 db 1 db 1 octave 1 octave Bode plots
=z 0 1 decade 1 decade Finite real pole:Phase vs. Frequency 0.1 rad 0.1 rad Bode plots
Conjugate zero pair: Bode plots
1 octave 1 octave 6 db 1 db Magnitude vs. frequency Bode plots
Phase vs. frequency 0 Bode plots
Conjugate pole pair: Bode plots
1 octave 1 octave Magnitude vs. frequency Bode plots
Phase vs. frequency 0 - Bode plots
T3 T1 T2 T4 Example Bode plots
Magnitude (dB) Phase (deg) 0 -20 -40 -60 90 0 -90 -180 0.1 1 10 100 Frequency (rad/sec) Bode plots
20 0 Magnitude (dB) -20 -40 -60 -45 -90 Phase (deg) -135 -180 -1 0 1 2 10 10 10 10 Frequency (rad/sec) Bode plots