Download
1 / 28
280 likes | 309 Views
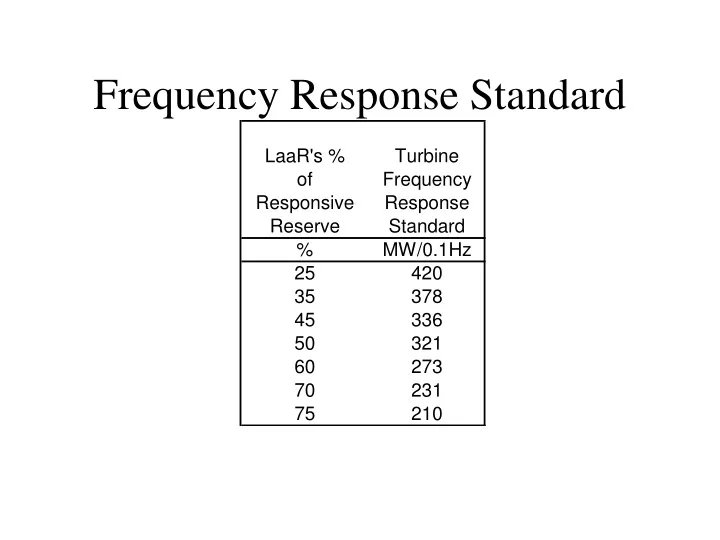
Frequency Response Standard. ERCOT Governor Droop. QSE 1 Performance. QSE 2 Performance. QSE 3 Performance. QSE 4 Performance. QSE 5 Performance. QSE 6 Performance. QSE 7 Performance. QSE 8 Performance. QSE 9 Performance. QSE 10 Performance. QSE 11 Performance. QSE 12 Performance.

E N D
Total Generation QSE telemetered Total Generation Hz Total Generation less CPK
Notes • Four QSE’s had data/telemetry problems before/during event • Data Quality flags did not work on one QSE’s data • ERCOT Regulation deployment was minimal due to large QSE SCE feedback and large Responsive Reserve deployment. • TXU placed on Constant Frequency control. • Some turbines had more governor response for the second event.
AVR Performance Measure • PDCWG members had concerns about data update times adequate to do an analysis • Faults last only cycles and data from QSEs is either 2 second or 10 second. • Voltage Regulator response will be limited to physical location/bus voltage connection and proximity to fault. Difficult to determine who/which generators should have responded. • AVR mode of operation may be determined by trending MVAR output of generators and observing changes in output (MVAR) as voltage is adjusted on neighboring generators.
Operations Report Changes • PDCWG recommended changes to ERCOT Operations report as requested. • The time frequency was at 60.00 Hz prior to the excursion was added, along with Load and Total Regulation deployed. • How long it took to reach the max/min frequency can be determined as well as how much load change occurred and Regulation Services were deployed as frequency deviated from schedule. • The Event “Cause” includes total Schedule change as well as the largest single QSE schedule change where appropriate. • A Picture speaks a 1000 words, one member suggested a graph of each event.
PDCWG Meeting June 25, 2003 • QSE Performance measure, SCPS1 and SCPS2 was reviewed. • ERCOT epsilon 10 was updated to correlate to the epsilon 1 change. The value changed from 0.0073 Hz to 0.01315 Hz effective July 1, 2003. • This change will increase the L10 value for the QSE SCPS2 measure and should make the standard more equivalent to the multiple control area CPS2 measure prior to single control area operation. • The SCPS2 measurement was thought to be important for QSE ramping performance.
Meeting continued • QSE Ramp Rates are being exceeded when deployments are for correcting congestion. • A request was made of ERCOT to recalculate May’s CPS1 score, but eliminate the periods when VDI’s were issued. This may correlate the low CPS1 score to the frequent Dispatch Instructions.