Download
1 / 1
10 likes | 184 Views
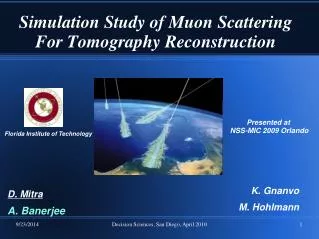
Live Event Display and Monitoring Program for a Muon Tomography Station. Michael Phipps, Judson Locke, Michael Staib; Adviser: Dr. Marcus Hohlmann Department of Physics and Space Sciences, Florida Institute of Technology. Single Muon Event. Abstract. Motivations and Capabilities.

E N D
Live Event Display and Monitoring Program for a Muon Tomography Station Michael Phipps, Judson Locke, Michael Staib; Adviser: Dr. Marcus Hohlmann Department of Physics and Space Sciences, Florida Institute of Technology Single Muon Event Abstract Motivations and Capabilities In the future, muon tomography may allow us to passively scan sensitive cargo and discern the composition of its content. Specifically, we are developing technology with the capability of alerting authorities to suspicious, potentially nuclear contraband. This past year, we built a muon tomography station using gas electron multiplier (GEM) detectors with an active volume of approximately one cubic foot. To accompany this station, we designed and integrated an event display that receives real-time processing data and visually recreates the path of the cosmic rays passing through our station. Any noticeable curvature in the track may be attributed to muon scattering as it passes through the dense objects being imaged. By obtaining precise measurements of the degree of deflection of lightly-interacting muons, we hope to identify the elemental composition of our objects. The event display program is coded in C++ using the ROOT Library, CERN´s data analysis platform for particle physics, and it is integrated into our interpretation of ALICE’s automatic monitoring environment. • Approachability: The display makes our research and analysis more transparent. • Error Checking: The display provides a sanity check for the validity of our data. • Event Discrimination: The display is capable of displaying only events passing through particular detectors or only events passing through particular targets within the station’s active volume. • Detector Coverage: The display allows for efficiency analysis of our station’s geometry and best placement determination of the object being imaged. Detector Coverage: This chart was made by altering the position of the target within our program while using the same batch of data. There were 50,000 total events processed. The side intersecting events exclude any Top/Bottom events, showing, in effect, the efficiency of our side detectors. Figure 5: Figure 2 (left): • Figure 3: Muon Tomography Station In this display, only a single event is shown. One event is defined as two tracks – one incoming and one outgoing. The incoming track is drawn in red and the outgoing track is drawn in blue. The left panel shows the XZ projection of the event and the right panel shows the YZ projection of the same event. Total Muons Intersecting the Target Live Event and Monitoring Program After a detector is triggered, it sends signal information to a central processing station. The raw data is then compared to the plateau readings for the individual detectors in order to eliminate electrical noise. What we are left with is the detector hits and we reconstruct the tracks through a complex algorithm that groups hits based off their time and position. Incomplete events are not included in the current version of the code. This process may take several hours, but once it is done, that batch of data is sent for analysis. Our processing framework then parses each event and passes the track information to various sub-routines for analysis and display. The live GUI version of the event display receives its data at this point. It processes each track and creates a custom display based off user configuration. The display automatically updates whenever a new batch of data is received. The live version of the program is also designed to receive and display analysis data from other processes, giving it full monitoring capabilities while the track information is being processed. Figure 2: YZ Projection Figure 1: XZ Projection This is the muon tomography station in its current form with images of its XZ and YZ projections, correlating to the projections on the 2-d display. Note: In the image of the YZ projection, the object being imaged is visible on the station’s central tray. Figure 4: In this display, 50,000 events were processed and only the 1,636 events that passed through the target – denoted by a green square. – are shown. This cut allows us to simply enter the coordinates of the object being imaged and display only those complete events that passed through the object.