Download
1 / 21
210 likes | 286 Views
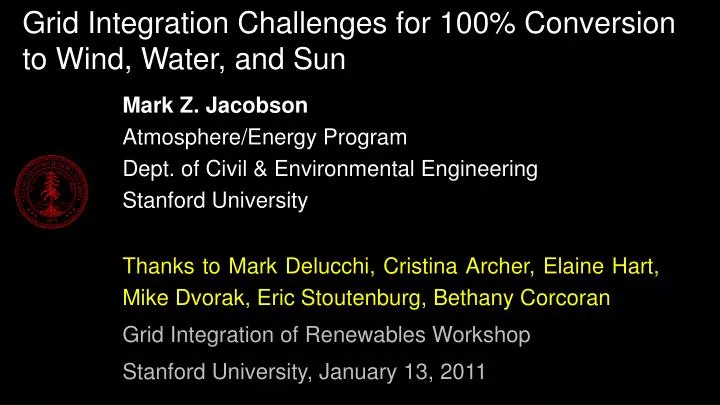
Grid Integration Challenges for 100% Conversion to Wind, Water, and Sun. Mark Z. Jacobson Atmosphere/Energy Program Dept. of Civil & Environmental Engineering Stanford University Thanks to Mark Delucchi , Cristina Archer, Elaine Hart, Mike Dvorak, Eric Stoutenburg , Bethany Corcoran

E N D
Grid Integration Challenges for 100% Conversion to Wind, Water, and Sun Mark Z. Jacobson Atmosphere/Energy Program Dept. of Civil & Environmental Engineering Stanford University Thanks to Mark Delucchi, Cristina Archer, Elaine Hart, Mike Dvorak, Eric Stoutenburg, Bethany Corcoran Grid Integration of Renewables Workshop Stanford University, January 13, 2011
Cleanest Solutions to Global Warming, Air Pollution, Energy Security – Energy & Env. Sci, 2, 148 (2009) Electric Power Vehicles Recommended – Wind, Water, Sun (WWS) 1. Wind 2. CSP WWS-Battery-Electric 3. Geothermal 4. Tidal WWS-Hydrogen Fuel Cell 5. PV 6. Wave 7. Hydroelectricity Not Recommended Nuclear Corn ethanol Coal-CCS Cellulosic ethanol
Hydrogen Fuel Cell Ships & Tractors; Liquid Hydrogen Aircraft Ecofriend.org Zmships.eu Ec.europa.eu
Air-Source Heat Pump, Air Source Electric Water Heater, Solar Water Pre-Heater Midlandpower.com Conservpros.com Adaptivebuilders.com Heat pump water heater
Powering the World on Renewables Global end-use power demand 2010 12.5 TW Global end-use power demand 2030 with current fuels 16.9 TW Global end-use power demand 2030 converting all energy to wind-water-sun (WWS) and electricty/H2 11.5 TW (30% reduction) Conversion to electricity, H2 reduces power demand 30%
Number of Plants or Devices to Power World Technology Percent Supply 2030 Number 5-MW wind turbines50% 3.8 mill. (0.8% in place) 0.75-MW wave devices1 720,000 100-MW geothermal plants 4 5350 (1.7% in place) 1300-MW hydro plants4 900 (70% in place) 1-MW tidal turbines1 490,000 3-kW Roof PV systems6 1.7 billion 300-MW Solar PV plants14 40,000 300-MW CSP plants20 49,000 ____ 100%
World Wind Speeds at 100m m/s 90 10 8 0 6 4 All wind worldwide: 1700 TW; All wind over land in high-wind areas outside Antarctica ~ 70-170 TW World power demand 2030: 16.9 TW -90 2 -180 -90 0 90 180
World Surface Solar m/s All solar worldwide: 6500 TW; All solar over land in high-solar locations~ 340 TW World power demand 2030: 16.9 TW
Methods of addressing variability of WWS • Interconnecting geographically-dispersed WWS resources • Bundling WWS resources as one commodity and using hydroelectricity to fill in gaps in supply • Using demand-response management • Oversizing peak generation capacity and producing hydrogen with excess for industry, transportation • Storing electric power on site or in BEVs (e.g., VTG) • Forecasting winds and cloudiness better to reduce reserves
Frequency (%) Frequency (%) Frequency (%) Interconnecting Geographically-Dispersed Farms Interconnection (over 550 km x 700 km region) eliminated no-wind hours in aggregate and narrowed the range of the wind speed frequency distribution Archer and Jacobson (2003)
BUNDLING MARINE RENEWABLE RESOURCES • Combined Farms: • Lower variability • Fewer hours of zero power Wind Power % of Rated Power Combined 50% Wind 50% Wave Wave Power Wind Power Hourly Average (example week) V90 Vestas Wind Turbine % of Rated Power Wave Power Hourly Average (example week) Pelamis Wave Energy Converter Stoutenburg, E.D., Jenkins, N., Jacobson, M.Z., Renewable Energy, doi:10.1016/j.renene.2010.04.033, 2010. Photo credit: NOAA NDBC, Vestas Wind Systems A/S, Pelamis Wave Power Ltd
Matching Hourly Demand With WWS Supply by Aggregating Sites and Bundling WWS Resources – Least Cost Optimization for California For 99.8% of all hours in 2005, 2006, delivered CA elec. carbon free. Can oversize WWS capacity, use demand-response, forecast, store to reduce NG backup more Hart and Jacobson (2011); www.stanford.edu/~ehart/
Forecast Accuracy Effects on Reserve Needs Reducing root-mean-square forecast errors (RMSE) reduces the required spinning reserve capacity from NG, reducing system-wide carbon emissions for 2005-6 Scenario includes 4.8 GW geothermal, 17 GW in+out state hydro, 3.7 GW pumped storage hydro, 35-60 GW NG, no solar RMSE of Day-Ahead Hourly Wind Forecast: Hart and Jacobson (2011)
Reserve Base for NdO (Tg) Used in Permanent Magnets for Wind Turbine Generators Country Reserve Base Needed to power 50% of world with wind U.S.2.1 Australia1.0 China16.0 CIS3.8 India0.2 Others4.1 World27.3 4.4 (0.1 Tg/yr for 44 years) Current production: 0.022 Tg/yr Jacobson & Delucchi (2010)
Reserve Base for Lithium (Tg) Used in Batteries Country Reserve Base Possible number of vehicles @10kg/each U.S.0.41 with current known land reserves Australia0.22 China1.1 Bolivia5.4 Chile3.0 Argentina? Afghanistan? World land11+ 1.1 billion+ (currently 800 million) Oceans240 Jacobson & Delucchi (2010)
Area to Power 100% of U.S. Onroad Vehicles • Wind-BEV • Footprint 1-2.8 km2 • Turbine spacing 0.35-0.7% of US • Nuclear-BEV • 0.05-0.062% • Footprint 33%of total; the rest is buffer • Cellulosic E85 • 4.7-35.4% of US • Geoth BEV • 0.006-0.008% • Solar PV-BEV • 0.077-0.18% • Corn E85 • 9.8-17.6% of US
Long-Distance Transmission Costs (2007 $US) Component Low Med High Transmission distance (km)1200 1600 2000 Power capacity (MW)5000 5000 5000 Wind capacity factor0.45 0.38 0.33 Line, land, tower cost ($/MW)240,000 450,000 680,000 Station equipment ($/MW)120,000 150,000 180,000 Transmission loss (%/1000 km)3 4 6 Transmission line lifetime (yrs)70 60 50 Station equipment lifetime (yrs)30 30 30 Discount rate (%/yr) 3 7 10 Cost of l.d. transmission (¢/kWh) 0.3 1.2 3.2 Delucchi & Jacobson (2010)
Costs of Energy, Including Transmission (¢/kWh) Energy Technology 2005-2010 2020-2030 Wind onshore 4-7 ≤4 Wind offshore 10-17 8-13 Wave >>11 4-11 Geothermal 4-7 4-7 Hydroelectric 4 4 CSP 11-15 8 Solar PV >20 10 Tidal >>11 5-7 Conventional (+Externalities) 7 (+5)=12 5-7 (+5.5) =10.5-12.5 Delucchi & Jacobson (2010)
Summary • 2030 electricity cost 4-10¢/kWh for most, 8-13 for some WWS , • vs. fossil-fuel 5-7 + 5.5 externality = 10.5-12.5¢/kWh • Includes long-distance transmission (1200-2000 km) ~1¢/kWh • Requires only 0.41% of world land for footprint; 0.59% for spacing • (compared with 40% of world land for cropland and pasture) • Eliminates 2.5-3 million air pollution deaths/year • Eliminates global warming, provides energy stability
Summary, cont. Converting to Wind, Water, & Sun (WWS) and electricity/H2 will reduce global power demand by 30% Methods of addressing WWS variability: (a) interconnecting geographically-dispersed WWS; (b) bundling WWS and using hydro to fill in gaps; (c) demand-response; (d) oversizing peak capacity and producing hydrogen with excess for industry, vehicles; (e) on-site storage; (f) forecasting Materials are not limits although recycling may be needed. Barriers : up-front costs, transmission needs, lobbying, politics. New papers: www.stanford.edu/group/efmh/jacobson/Articles/I/susenergy2030.html