Download
1 / 2
20 likes | 103 Views
. TI 83/84 Statistics Summary – Statistics Plots. RVCC rme Page 1. TRACE. 2ND. STAT PLOT. Scroll down to Type:. Y=. Scroll left and right to see different critical points on boxplot. . Scroll across to: (modified boxplot) (boxplot). . ENTER. Enter Data Into a List. . ENTER.

E N D
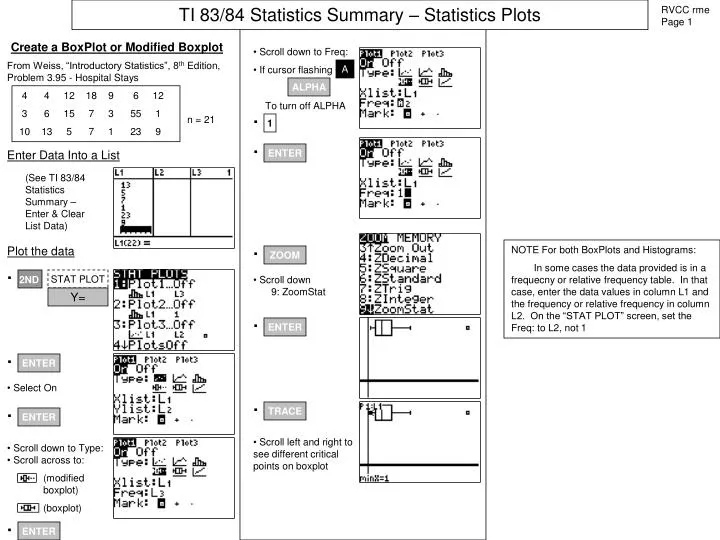
. TI 83/84 Statistics Summary – Statistics Plots RVCC rme Page 1 TRACE 2ND STAT PLOT • Scroll down to Type: Y= • Scroll left and right to see different critical points on boxplot . • Scroll across to: • (modified boxplot) • (boxplot) . ENTER Enter Data Into a List . ENTER (See TI 83/84 Statistics Summary – Enter & Clear List Data) • Scroll down to Freq: • Select On • If cursor flashing A . ALPHA ENTER To turn off ALPHA . 1 . ENTER . ZOOM • Scroll down 9: ZoomStat . ENTER Create a BoxPlot or Modified Boxplot From Weiss, “Introductory Statistics”, 8th Edition, Problem 3.95 - Hospital Stays 4 4 12 18 9 6 12 3 6 15 7 3 55 1 10 13 5 7 1 23 9 n = 21 Plot the data NOTE For both BoxPlots and Histograms: In some cases the data provided is in a frequecny or relative frequency table. In that case, enter the data values in column L1 and the frequency or relative frequency in column L2. On the “STAT PLOT” screen, set the Freq: to L2, not 1
TI 83/84 Statistics Summary – Statistics Plots RVCC rme Page 2 2ND STAT PLOT Y= . Enter Data Into a List . ENTER (See TI 83/84 Statistics Summary – Enter & Clear List Data) • Select On . ENTER . ZOOM • Scroll down 9: ZoomStat • Scroll across to: (histogram)) ENTER Create a Histogram • Scroll down to Freq: • If “A” flashing • (Set Xmax to largest value + bin witdh (221+5 = 226) From Weiss, “Introductory Statistics”, 8th Edition, Table 2.14 – Cholesterol levels . ALPHA 2 2 6 ENTER 210 209 212 208 217 207 210 203 208 210 210 199 215 221 213 218 202 218 200 214 . n = 20 1 ENTER • (Set Xscl to bin witdh) . 5 ENTER • (Set Ymin to 0) . Plot the data 0 ENTER . ENTER • (Set Ymin bigger than the most frequently occurring value) . 9 ENTER Adjust the window . . GRAPH WINDOW • Scroll down to Type: . • (Set Xmin to “left edge” of first bar) TRACE . • (Scroll across the bars to see bar widths and frequency) . 1 9 0 ENTER