Download
1 / 25
250 likes | 288 Views
Errors in Physical Measurements. Error definitions Measurement distributions Central measures. Errors are uncertainties. Every physical measurement has an uncertainty , i.e., it has an error . Random uncertainties (errors) Can be reduced but not eliminated.

E N D
Errors in Physical Measurements Error definitions Measurement distributions Central measures
Errors are uncertainties... • Every physical measurement has an uncertainty, i.e., it has an error. • Random uncertainties (errors) • Can be reduced but not eliminated. • No measurement is infinitely precise. • Determines the precision of the data. • Systematic uncertainties (errors) • Can be reduced and eliminated • Produces systematic shifts in the data • Determines the accuracy of the data. • The problem: What is the best way to find the values for ak which most likely represent the parent population from which our sample is obtained?
Errors are uncertainties... • Errors are not blunders or mistakes. • Blunders or mistakes - • Must be found and corrected. • Are not quoted in error estimates on measurements. • “Human Error” is not a valid error. • Errors are quoted as x ± sx. • sx needs to be estimated - • From the data. • From the measurement. • May have asymmetric values about x
The parent population... • If you are measuring a physical quantity (x) e.g., the distance a neutron penetrates into a given material, repeating the experiment N times produces slightly different values for (x), i.e., (xi) :where i goes from 1 to N. • If N goes to ∞, then this is the total of all possible measurements of this quantity - and this set is called the Parent Population.
The sample population... • If N is finite, this will be a sample of the total number of all possible measurements of this quantity (x) - and this smaller set of measurements is called the Sample Population. • We will make notational distinctions between these populations.
The sample population... • If N is large, the results obtained from the sample population of measurements will approach those of the parent population, but-- • We will never know the actual values from the parent population, even though we seek them. • Our goal is to find the best estimates of the parent population values -
The sample population... • …and to estimate the precision and accuracy of our estimate of (x) . • This latter exercise is callederror analysis. • Results are often reported as x ± sx ± ex where x is the best representative value of (x), sx is the estimate of the random error, and ex is the estimate of the systematic error.
Deviation... • Because we cannot know(x) from the parent population (the “true” value) we cannot formally compare our value with a “true” measurement of (x). • There arefew quantities whose value is predicted exactly from theory. For example: • The charge on 1 electron is 1.6 x 10⁻¹⁹ C. • The speed of light is 2.998 x 10⁸ m/s. • The gravitational constant is 6 x 10-11 N m2/kg2 All measured!
Deviation... • Therefore, our measurement of (x) can only be compared with the another measurement of (x), each of which has an uncertainty (experimental error), and neither of which is the “true” value. • Such a comparison results in a deviation between the two measured quantities - or between a measured quantity and a theoretically expected quantity.
Deviation... • However, on the basis of measurement theory, we may postulate what the expected form of the distribution of measurements (xi) should be expected to be. • A plot of v vs t for a freely falling object. • A plot of the distribution (histogram) of measurements of neutron depth in indium. • A plot of the angular distribution of photons from e+ e- annihilation.
Deviation... • It is therefore useful to compare not only the best estimate of (x), but also the distribution of measured values of (x) . • If the distributions do not appear to agree, what does this mean? • A problem with the experiment? • A problem with the theory? • Both?
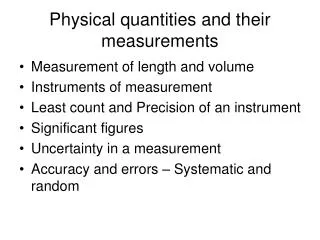
Quantitative representations... • Given a set of N measurements, what are quantitative ways of expressing results? • The mean, m = <x> • The deviation, d = (x - <x>) • The variance, s2 = <(x - <x>)2> • The standard deviation s = √<(x - <x>)2> • Each quantity has physical units! Don’t forget to include them! • Know how to compute each.
Computatons: the mean • The sample mean is defined as: • The parent population mean is then:
Computatons: the deviation • The sample deviation is defined as: • The parent population deviation is then:
Computatons: the variance • The sample variance is defined as: • The parent population variance is then:
...the standard deviation • The sample standard deviation is defined as: • The parent population standard deviation is then:
Distributions... • Take a set of N measurements. • Form a histogram of the measurements. (This gives the distribution of the measurements.) • This gives the number of measurements of between x and x +Dx as nj, j = 1,k where k is the total number of bins. (Dx is the fixed bin width.) • Now, with this you can estimate m and s because nj represents a distribution function for the measurements xi . How do you do it?
Distributions... • The mean and standard deviation from a distribution are:
Normalized Distributions... • From a histogram of the N measurements, you can form a normalized distribution of the measurements. • Take each value nj, j = 1,k and divide it by N. This will give the fractional number fj of all measurements in the bin j. The sum of all fj will be 1, and hence the distribution function fj is a normalized (discrete) distribution. • If N is very large, his concept can be extended to a continuous probability functionP(x).
Normalized distributions... • The mean and standard deviation from a normalizeddiscrete distribution are:
Normalized distributions... • The mean and standard deviation from a continuous distribution are:
Normalized distributions... • The denominator is just:
Normalized distributions... • The standard deviation is then:
Normalized distributions... • …or in terms of a probability function P(x):
Normalized distributions... • Or for any function: