Download
1 / 27
290 likes | 503 Views
Physical Measurements. "An experiment is a question which science poses to Nature, and a measurement is the recording of Nature's answer.“ ~ Max Planck. Anthony E. Butterfield CH EN 4903-1. Physical Measurements. Preparation for physical measurements in 4903.

E N D
Physical Measurements "An experiment is a question which science poses to Nature, and a measurement is the recording of Nature's answer.“ ~ Max Planck Anthony E. Butterfield CH EN 4903-1
Physical Measurements • Preparation for physical measurements in 4903. • Basics of physical measurements. • Error terminology. • Sources of error. • Calibration. • Instrument types. • An experiment.
Preparation - Tasks • Topics covered in the preliminary lab conference. • Know what you can do. • Know what you should and shouldn’t do, EHS concerns. • Understand the theory and error considerations. • Organize who in your team will be primarily responsible for each task. • Running equipment. • Taking and testing samples. • Keeping detailed record of the experiment.
Preparation - Time • Time for set up, sample prep, reaching desired conditions. • Time for collecting desired data. • Time for shut down, disposal of waste, cleaning up workspace. • Time for things to go terribly, unexpectedly wrong. • This is normal • Expect it in senior lab, and in your professional life.
Big Picture Reason for Physical Measurements • “About thirty years ago there was much talk that geologists ought only to observe and not theorize; and I well remember some one saying that at this rate a man might as well go into a gravel pit and count the pebbles and describe the colors. How odd it is that anyone should not see that all observation must be for or against some view if it is to be of any service!” ~ Charles Darwin
Big Picture Problems with All Measurements • "What we observe is not nature itself, but nature exposed to our method of questioning.” ~ Werner Heisenberg • "No amount of experiments can ever prove me right; a single experiment may at anytime prove me wrong.” ~ Albert Einstein
Basics of Physical Measurements • Measurements are only as good as your measuring devices. • Including the analytical equipment standard on humans. • You will never know if you have the “true value”. • Error is ever present; science is ever provisionary.
Error Terminology • Random Error –Fluctuations in the measured value with repeated measurements. • Systematic Error – The difference between the mean of many measurements and the true value. • Offset error: constant systematic error. • Scale factor error: error proportional to the true value. • Drift: systematic error that changes with time. • Illegitimate Error –Error caused by poor technique or choice of methods, mistakes.
Sources of Random Noise • Randomness and uncertainty is fundamental. • Thermal vibrations. • EM noise (nearby electronics, solar activity, etc.). • Mechanical vibrations. • Fluctuations in ambient conditions. • Digitization. • Sampling Error. • Using a fraction to representthe whole. • Errors in human judgment.
Sources of Systematic Errors • Calibration. • Calibrated incorrectly. • Calibrated at conditions other than those of the experiment. • Calibration has expired due to drift. • Poor methods. • Did not wait to reach equilibrium. • Human judgment. • Parallax error. • Sampling. • Fraction sampled does not represent whole.
Terminology • Precision – A measure of the reproducibility of our measurements, with no relation to the true value. • Indication of random errors. • Accuracy – A measure of how close our result comes to the true value. • Indication of systematic errors.
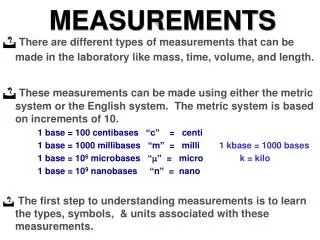
Terminology • Limits of Detection – The smallest value which can be detected. • Discrepancy – Difference between values for the same measurement. • Uncertainty – An estimate of the range of error. • Always determined for a particular confidence interval.x = <x> ±dx (95% confidence level) • Significant Figures – The number of meaningful digits in a value. • Example: A 1.0 L tanks fills in 7.0 min:Average flow rate = 1 L / 7 min = 0.1428571428571428571428571428571428571428571428571428571428571428571428571428571428571428571428571429… L/min • Sticking to base ten is an arbitrary limit when relying on sigfigs 0.14 vs. 0.142 ± 0.001 (95% confidence level)
Calibration • Your measuring device is only as good as its calibration.
Calibration • Use primary standards. • Highly pure and stable substances with well established properties. • Might use tabulated values. • E.g. boiling points. • Use calibration conditions that encompass experimental conditions. • Some equipment must be calibrated just prior to every use; others may need calibration rarely. • Some equipment may need to be calibrated by manufacturer. • Linear verses non-linear calibration curves. • TC (Example):
Instrument Types • Off-Line • Weight, density, spectroscopy, microscopy… • Issues: • Sampling • Sample preparation • On-Line • Flow, level, temperature, pressure…
Choosing Measuring Devices • What accuracy and precision is desired? • Which measurement has the greatest bearing on your calculations? • Error analysis. • The ease of measurement? • Equipment’s signal to noise ratio? • Detection limits? • Calibration?
Analytical Equipment in the Lab • UV/Vis (Ultraviolet/Visible Light Spectroscopy) • FTIR (Fourier Transform Infrared Spectroscopy) • AA (Flame Atomic Adsorption Spectroscopy) • Refractometer • HPLC (High Performance Liquid Chromatography) • GC (Gas Chromatography) • Viscometers • Others…
Fudging Physical Measurements • Purposeful • Serious ethical consequences. • Serious practical and professional consequences. • Semi-Purposeful • Your senses and attentions are some of the more suspect pieces of equipment in the lab. • Attention gravitates to expectation; confirmation bias. • 2-4-6 Problem. • Less than 40% of Scientists in one study1 were found to seek disconfirming evidence. 1. MAHONEY, MICHAELJ. AND DEMONBREUN, B. G., "Psychology of the Scientist: An Analysis of Problem-Solving Bias," Cognitive Therapy and Res., Vol. 1 (1977), pp. 229-238.
The Wrong Answer • The data you collect are what they are. • "Facts are stubborn things; and whatever may be our wishes, our inclinations, or the dictates of our passions, they cannot alter the state of facts and evidence." ~ John Adams • In most all real world situations, to agree perfectly with theory with every measurement would be very strange and very suspect. • Imperfect accuracy and precision in your physical measurements will not cost you points. • Give a reasonable explanation as to why. • If error is due to poor methods, you would lose points even if you stumbled on the “right” answer. • The right theory is another matter.
Conclusions • Physical measurements take preparation • Learn your terminology. • Account for the possible sources of random and systematic error. • Calibrate just a bit more often than you feel is reasonable. • Know your equipment’s limitations and strengths, precision and accuracy. • Measure both what will prove you right and what will prove you wrong.
I Have a Hypothesis: • All surfaces on objects that appear, to my eye, to have the same distance from the surface’s centroid to any point on the surface’s border, regardless of the point on the border chosen, have the same ratio of the perimeter length to the distance from the centroid to the border. • Basically: Things that look like circles are circles. • Test the hypothesis.
Relevant Theory • Theory predicts… • So do we know the “true” value in this case? 3.141592653589793238462643383279502884197169399375105820974944592307816406286208998628034825342117067982148086513282306647093844609550582231725359408128481117450284102701938521105559644622948954930381964428810975665933446128475648233786783165271201909145648566923460348610454326648213393607260249141273724587006606315588174881520920962829254091715364367892590360011330530548820466521384146951941511609433057270365759591953092186117381932611793105118548074462379962749567351885752724891227938183011949129833673362440656643086021394946395224737190702179860943702770539217176293176752384674818467669405132000568127145263560827785771342757789609173637178721468440901224953430146549585371050792279689258923542019956112129021960864034418159813629774771309960518707211349999998372978049951059731732816096318595024459455346908302642522308253344685035261931188171010003137838752886587533208381420617177669147303598253490428755468731159562863882353787593751957781857780532171226806613001927…
Methods • Issues of accuracy? • Issues of precision? • What kind of error is present? • How could we improve our methods?
Your Physical Measurements Object Name Diam. Circum. C/D Res. Pass? Battery 4.4 ± 0.1 14.0 ± 0.1 3.182 ± 0.08 0.04 1 Scotch Tape 2.6 ± 0.0 8.2 ± 0.0 3.154 ± 0.00 0.01 0 Duct Tape 5.3 ± 0.1 16.8 ± 0.3 3.190 ± 0.06 0.05 1 Floppy 6.3 ± 0.1 19.0 ± 1.0 3.016 ± 0.17 -0.13 1 Fitting 8.8 ± 0.0 27.7 ± 0.2 3.148 ± 0.02 0.01 1 Gold Doubloon 3.5 ± 0.0 10.7 ± 0.2 3.057 ± 0.06 -0.08 0 Red Cap 4.1 ± 0.5 12.9 ± 1.0 3.146 ± 0.45 0.00 1 White Cap 4.0 ± 0.0 12.5 ± 0.0 3.125 ± 0.00 -0.02 0 Black Cap 7.8 ± 0.0 24.6 ± 0.0 3.154 ± 0.00 0.01 0 Soup Can 6.7 ± 0.5 21.3 ± 0.1 3.172 ± 0.24 0.03 1 Frisbee 8.8 ± 0.1 27.8 ± 0.5 3.149 ± 0.06 0.01 1 Poker Chip 27.0 ± 0.5 85.0 ± 1.0 3.148 ± 0.07 0.01 1 Toy Wheel 5.6 ± 0.1 17.1 ± 0.2 3.054 ± 0.07 -0.09 0 Spool of Wire 25.9 ± 0.1 81.5 ± 0.1 3.147 ± 0.01 0.01 1 Plastic Cup 9.8 ± 0.0 31.4 ± 0.0 3.204 ± 0.00 0.06 0 Paper Cup 2.9 ± 0.0 9.3 ± 0.0 3.168 ± 0.00 0.03 0 Average C/D = 3.138311 Average res. = -0.003282 Probability null hypothesis is true: 0.804638 The winner is: Red Cap
Results • If “” ≈ • Confidence in our hypothesis is increased. • Yet nothing is “proven”. • Publish results:A.E.Butterfield, et al., “The Circularity of Circular Looking Stuff”, Nature, 2009 • If “” Does Not ≈ • Confidence in our hypothesis is diminished. • Check our methods • Questioning “theory”, in this case, is probably not wise.