Download
1 / 26
260 likes | 267 Views
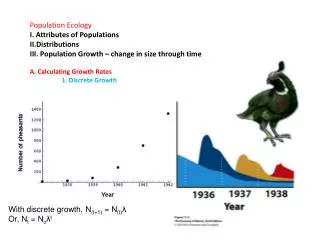
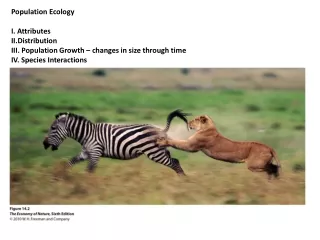
Population Ecology I. Attributes II.Distribution III. Population Growth – changes in size through time IV. Species Interactions V. Dynamics of Consumer-Resource Interactions. Population Ecology I. Attributes II.Distribution III. Population Growth – changes in size through time

E N D
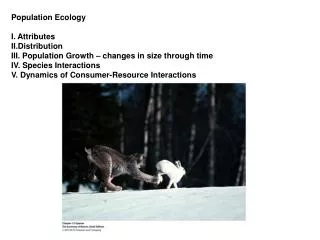
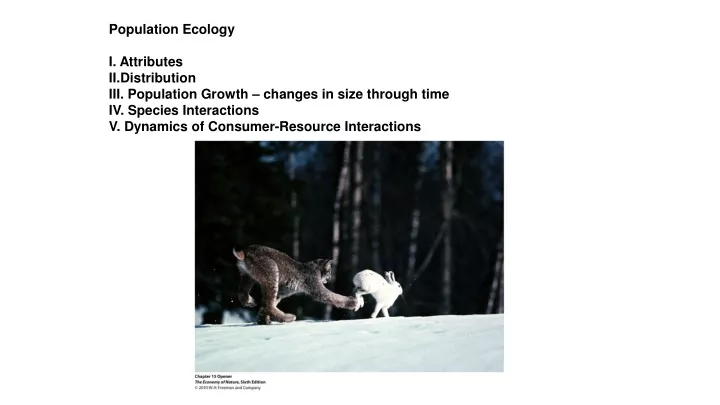
Population Ecology I. Attributes II.Distribution III. Population Growth – changes in size through time IV. Species Interactions V. Dynamics of Consumer-Resource Interactions
Population Ecology I. Attributes II.Distribution III. Population Growth – changes in size through time IV. Species Interactions V. Dynamics of Consumer-Resource Interactions A. Like Limiting Resources, Predators Reduce Population Size/Growth Predators “Top down” Target Species “Bottom up” Limiting Resources
Opuntia introduced into Australia for “living fenceposts”… quickly spread
Opuntia introduced into Australia for “living fenceposts”… quickly spread Cactoblastic catorum introduced from Argentina – 95% reduction in 20 years.
Opuntia introduced into Australia for “living fenceposts”… quickly spread Cactoblastic catorum introduced from Argentina – 95% reduction in 20 years. Introduced in Africa and West Indies, and has invaded Florida and is wiping out several native species.
Cyclamen mites: Important crop pests (strawberries, in particular). Females reproduce parthenogenetically and produce 10-40 offspring/day. If prey increase when predators are removed, then predators were limiting population growth
Kelp and Urchins In 1940's: As urchin density increases, kelp beds “retreat” (negative displacement) at a rate of meters/month
Moose and Wolves - Isle Royale 1930's - Moose population = ~2400 on Isle Royale
1930's - Moose population about 2400 on Isle Royale 1949 - Wolves cross on an ice bridge; studied since 1958
1930's - Moose population about 2400 on Isle Royale 1949 - Wolves cross on an ice bridge; studied since 1958
http://www.sciencemag.org/news/2016/04/extreme-inbreeding-likely-spells-doom-isle-royale-wolveshttp://www.sciencemag.org/news/2016/04/extreme-inbreeding-likely-spells-doom-isle-royale-wolves
V. Dynamics of Consumer-Resource Interactions A. Predators can limit the growth of prey populations B. Oscillations are a Common Pattern – Why?
V. Dynamics of Consumer-Resource Interactions A. Predators can limit the growth of prey populations B. Oscillations are a Common Pattern – Why? Specialist predators and time lags between food consumption and increase in predator population (gestation)
A refuge where prey can hide and increase their population (seasonal, here): Voles and Owls in Sweden – Damped Oscillations: Decrease in snow pack makes voles susceptible to owls all year, reducing the lag and reducing the amplitude of oscillations Winter refuge for voles beneath the snow
In parasites where hosts develop immunity, the parasite can only increase after a population of susceptible hosts (babies) are produced. Measles in London: 1948-1968 (before vaccine).
V. Dynamics of Consumer-Resource Interactions A. Predators can limit the growth of prey populations B. Oscillations are a Common Pattern C. Models 1. Host-Pathogen Models
V. Dynamics of Consumer-Resource Interactions A. Predators can limit the growth of prey populations B. Oscillations are a Common Pattern C. Models 1. Host-Pathogen Models Dependent on: a. the rate of transmission (b) (“infectability”) b. the rate of recovery (g) (inversely related to the period during which the host is contagious) c. the number of susceptible (S), infectious, and recovered hosts
V. Dynamics of Consumer-Resource Interactions A. Predators can limit the growth of prey populations B. Oscillations are a Common Pattern C. Models 1. Host-Pathogen Models Dependent on: a. the rate of transmission (b) b. the rate of recovery (g) (inversely related to the period during which the host is contagious) c. the number of susceptible (S), infectious, and recovered hosts The reproductive ratio of the pathogen =(b/g)S so a pathogen population will grow (R > 1, epidemic) if : the rate of transmission is high (infectious) recovery is slow (creating a long period of contagion) susceptible individuals are common. In this case, each infected individual infects more than one new host and the disease spreads.
V. Dynamics of Consumer-Resource Interactions A. Predators can limit the growth of prey populations B. Oscillations are a Common Pattern C. Models 1. Host-Pathogen Models As a disease proceeds and the number of susceptible individuals declines, R < 1 and the epidemic declines. In the simplest version of this model (single generation), oscillations don’t occur because there is no production of new susceptible people and immunity after recovery is permanent. However, if you add the production of susceptible newborns or susceptible immigrants, or allow for vertical transmission from parent to offspring, or add a latency period, or allow for reinfection (and not lifetime immunity), oscillations and cyclic epidemic occur because the number of susceptible people can increase… driving R > 1.
so a pathogen population will grow (R > 1, epidemic) if : the rate of transmission is high recovery is slow (creating a long period of contagion) or susceptible individuals are common. In this case, each infected individual infects more than one new host and the disease spreads. Cold and Flu: Transmission rate “low” - 34% Recovery slow, favoring spread (Viral integrity is greatest under low humidity, and particles remain small (don’t take on water and fall out of the air column). Cool temps reduce ciliary beating in nasal and respiratory mucosa, favoring viral reproduction. Both cause higher transmission rates in winter. Lowen, et al. 2007. http://www.plospathogens.org/article/info%3Adoi%2F10.1371%2Fjournal.ppat.0030151
so a pathogen population will grow (R > 1, epidemic) if : the rate of transmission is high recovery is slow (creating a long period of contagion) or susceptible individuals are common. In this case, each infected individual infects more than one new host and the disease spreads. Ebola: Transmission rate “high” ~75% 99% fatality rate – short contagious period Deadly pathogens need a high transmission rate to persist, or a very dense population (S).
so a pathogen population will grow (R > 1, epidemic) if : the rate of transmission is high recovery is slow (creating a long period of contagion) or susceptible individuals are common. In this case, each infected individual infects more than one new host and the disease spreads. 1918 Flu Epidemic (H1N1): Killed 50-100 million people; 3-5% of the global population Transmission rate was high because of high density of susceptible hosts (military), and movement of carriers across Europe (military and migrating refugees). High density selected for more aggressive and lethal form
Reduce Transmission Rate: - stay clean - stay home Reduce Contagious Period: - stay healthy Reduce # of Susceptible Hosts: - get vaccinated