Download
1 / 54
540 likes | 674 Views
Chap. 6 Population Ecology (I). 鄭先祐 (Ayo) 國立台南大學 環境與生態學院. 2008 年 2 月至 6 月. Population ecology. Properties of the population Basic concepts of rate Intrinsic rate of natural increase Concept of carrying capacity Population fluctuations and cyclic oscillations

E N D
Chap. 6 Population Ecology (I) 鄭先祐 (Ayo) 國立台南大學 環境與生態學院 2008年2月至6月
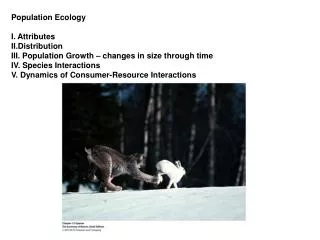
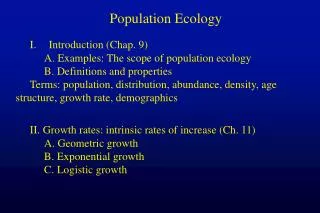
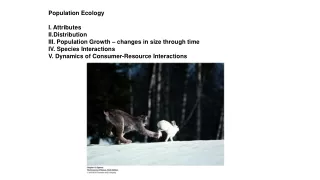
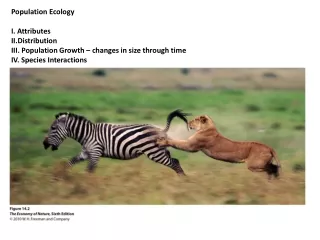
Population ecology • Properties of the population • Basic concepts of rate • Intrinsic rate of natural increase • Concept of carrying capacity • Population fluctuations and cyclic oscillations • Density-independent and density-dependent mechanisms of population regulation chap.6 population ecology (I)
Patterns of dispersion • The Allee principle of aggregation and refuging • Home range and territoriality • Metapopulation dynamics • Energy partitioning and optimization: r- and K-selection • Population genetics • Life history traits and tactics chap.6 population ecology (I)
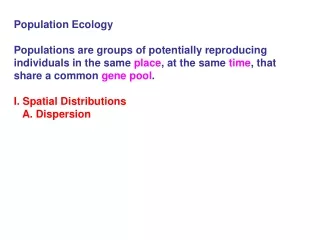
1 Properties of the Population • Population density • Crude density • Ecological density • Relative abundance • Frequency of occurrence • Importance value chap.6 population ecology (I)
Fig. 6-1. The range of population density (biomass per hectare) of various species of mammals. chap.6 population ecology (I)
Methods for estimating population densities • Mark-recapture method • Minimum known alive (MKA) method, calendar-of-catches method • Total counts • Quadrate or transect sampling • Removal sampling • Plotless method, point-quarter method • Importance percentage value, relative density, relative dominance, relative frequency chap.6 population ecology (I)
補充 mark-recapture methods §assumptions • 1. 研究期間內, 標記永久性, 且再捕獲時可正確記錄。 • 2. 加標記處理後, 再被捕之機率, 不變。 • 3. 加標記處理後, 死亡率和遷移率, 不受影響。 • 4. 加標記處理後, 此個体與其它個体的混合(隨機)。, 不會影響其被捕獲率。 • 5. 取樣時間相對於調查期間,是短的。 估計時是quasi-continuous 實際上是continuous • 6. (Petersen): no births, no immigrations no deaths, no emigrations chap.6 population ecology (I)
補充 §調查方法與公式 (一) Petersen estimate (1896): Lincoln index (1930) • 最簡單,只有一次釋放,一次再捉。 n: total size of recapture m: no of individuals marked (x) r: marked individuals released (M) N: 當時之population size r n r(n+1) N = ── or N = ──── (Bailey, 1950) m (m+1) r (n+1)(n-m) SE = ─────── (m+1) (m+2) chap.6 population ecology (I)
補充 (二) Weighted mean 的方法: 類似Lincoln index ( Mini) (48+52+105) N = ───── = ────── = 34.2 ( mi)+1 (1+2+2)+1 1 2 6 SE = N ──── + ───── + ───── mi + 1 ( mi + 1) ( mi + 1) 例: Apodemus sylvaticus (鼠) day i 1 2 3 4 number ni - 6 4 7 marked mi - 1 2 2 release ri 8 6 4 - 全部Marked Mi - 8 13 15 Mini 48 52 105 chap.6 population ecology (I)
補充 (三) Jackson's positive method (四) The triple catch method day 1: marked r1, released. day 2: m21 are marked, all r2 marked and released. day 3: m31 only day 1 mark, m32 include all day 2 mark. 例: females of the grasshopper. day 1 2 3 捕捉50(n2) 38(n3) day 1-marked 11(m21) 5(m31) day 2-marked 9(m32) 釋放42(r1) 50(r2) chap.6 population ecology (I)
補充 (四) The triple catch method m31(r2 + 1) 5 x 51 M21 = ────── + m21 M21 = ──── + 11 =36.5 (m32 + 1) 10 (n2 + 1) M21 51 x 36.5 N2 = ─────── N2 = ───── = 155.1 (m21 + 1) 12 M21 36.5 Φ1 = ───Φ1 = ─── = 0.87 r1 42 (m31 + 1) n2 6 x 50 b2 = 1 - ────── b2 = 1 - ──── = 0.30 (n3 + 1) m21 39 x 11 SE(N2) = 64.7 SE(Φ1) = 0.32 chap.6 population ecology (I)
補充 §調查方法與公式 • (五) Jackson's negative method • (六) Fisher-Ford method • (七) Jolly's stochastic method • -- the most recent mark is noted, all previous marks are ignored. chap.6 population ecology (I)
──────────────────────────────────────────────── Day 捕釋Time of release of markds, j i ni ri 1 2 3 4 5 6 7 8 9 10 11 12 ────────── recaptured marks, mij ───── 1 - 54 2 146 143 10 3 169 164 3 34 4 209 202 5 18 33 5 220 214 2 8 13 30 6 209 207 2 4 8 20 43 7 250 243 1 6 5 10 34 56 8 176 175 0 4 0 3 14 19 46 9 172 169 0 2 4 2 11 12 28 51 10 127 126 0 0 1 2 3 5 17 22 34 11 123 120 1 2 3 1 0 4 8 12 16 30 12 120 120 0 1 3 1 1 2 7 4 11 16 26 13 142 - - 1 - 2 3 3 2 10 9 12 18 35 ──────────────────────── 補充 y6 z6 m6 chap.6 population ecology (I)
─────────── Day 釋 i ri mi yi zi ─────────── 1 54 - 24 - m6=2+4+8+20+43=77 2 143 10 80 14 3 164 37 70 57 y6=56+19+12+5+4+2+3=101 4 202 56 71 71 5 214 53 109 89 z6=1+6+5+10+34+0+...+1+0+1+0+2+3=121 6 207 77 101 121 7 243 112 108 110 8 175 86 99 132 9 169 110 70 121 10 126 84 58 107 11 120 77 44 88 12 120 72 35 60 13 - 95 - - ─────────── 補充 chap.6 population ecology (I)
ziri 121x207 Mi= mi + ─── m6= 77 + ──── = 324.99 yi 101 110 x 243 m7=112 + ───── = 359.50 108 Mi(ni + 1) 324.99 x 210 Ni=────── N6= ────── = 874.97 (mi + 1) 78 359.50 x 251 N7= ────── = 798.54 113 Mi + 1 359.5 Φi = ──────Φ6 = ─────── = 0.79 Mi - mi + ri 325 - 77 +207 Bi = Ni+1 - ΦiNi B6 = 798.5 - 0.79 x 875.0 =107.3 SE(N6) = 94 SE(Φ6) = 0.068 SE(B6) = 75 補充 chap.6 population ecology (I)
補充 §處理的方法 • 1. capture -- insects, Southwood (1966) -- freshwater, Lagler (1971) -- amphibians and reptiles, Woodbury (1956) -- mammals, Twigg (1975) -- birds and mammals, Taber and Cowan (1969) • 原則: (1) equal chance of being caught (2) sufficient data chap.6 population ecology (I)
補充 §處理的方法 • 2. Handling -- Insects, chloroform, ether, NO2, N2, CO2 -- fish, MS-222 -- mammals, bag -- birds, darkness • 原則:不要受傷害 chap.6 population ecology (I)
補充 §處理的方法 • 3. Marking (對象) -- insects, Southwood (1966) -- fish, Stott (1977) -- amphibians and reptiles, Woodbury (1956) -- mammals, Twigg (1975) -- mammals and birds, Taber and Cowan (1969) chap.6 population ecology (I)
補充 • 4. Marking (工具) (1) paints: insects--dots color fish-- injecting color dyes (2) dusts: insects (3) mutilation (切斷) (4) tags and bands (5) radioactive labels • 5. Release -- capture, mark and release, during the same period at the same site. chap.6 population ecology (I)
補充 §參考文獻 • Begon, M. (1979) Investigating animal abundance: capture-recapture for ecologists. Edward Arnold Limited, London. • Bishop, J. A. and D. J. Hartley (1976) The size and age structure of rural populations of Rattus norvegicus containing individuals resistant to the anti-coagulant poison warfarin. J. Anim. Ecol. 45:623-646. • Lagler, K. F. (1971) Capture, sampling and examination of fishes. In: Methods for Assessment of Fish Production in Fresh Waters. Ricker, W. E. (ed.), Blackwell, Oxford. • Southwood, T. R. E. (1966) Ecological methods. Methuen, London. chap.6 population ecology (I)
補充 • Stott, B. (1971) Marking and tagging. In: Methods of Assessment of Fish Production in Fresh Waters. Ricker, W. E. (ed.), Blackwell, Oxford. • Taber, R. D. and Cowan, I. M. (1969) Capturing and marking wild animals. In: Wildlife Management Techniques. Giles, R. H., Jr. (ed.), The Wildlife Society, Washington. • Twigg, G. I. (1975a) Catching mammals. Mammal Rev. 5:83-100. • Twigg, G. I. (1975b) Marking mammals. Mammal Rev. 5:101-116. • Woodbury, A. A. (1956) Uses of marking animals inecological studies: marking amphibians and reptiles. Ecology 37:670-674. chap.6 population ecology (I)
Natality and mortality • Natality, is the ability of a population to increase by reproduction. • Maximum natality • Ecological (realized) natality • Mortality, quantifies death of individuals in a population. • Ecological (realized) mortality • Minimum mortality • Survival rate =1-M chap.6 population ecology (I)
Table 6-1 chap.6 population ecology (I)
Fig. 6-2. Survivorship curve for the data tabulated in Table 6-1 for Dall mountain sheep, chap.6 population ecology (I)
Fig. 6-3. types of survivorship curves. chap.6 population ecology (I)
Fig. 6-4 Survivorship curves for two stable mule deer populations. chap.6 population ecology (I)
Fig. 6-5. Age pyramids (A) three types of age pyramids. chap.6 population ecology (I)
Fig. 6-5. (B) Age pyramids for laboratory populations of the vole (Microtus agrestis) chap.6 population ecology (I)
Fig. 6-6. Population age pyramids for different human populations. chap.6 population ecology (I)
Fig. 6-7. Age distribution in the commercial catch of herring in the North /sea between 1907 and 1919, illustrating the dominant age class phenomenon. chap.6 population ecology (I)
2 Basic Concepts of Rate • Population dynamics • dN/dt = the rate of change in the number of organisms per time at a particular instant • dN/Ndt = the rate of change in the number of organisms per time per individual at a particular instant. • Growth rate chap.6 population ecology (I)
Fig. 6-8. (A) population growth curve chap.6 population ecology (I)
Fig. 6-8. (B) rate of increase growth curve for the same hypothetical population during the same interval of time. chap.6 population ecology (I)
3 Intrinsic Rate of Natural Increase • dN/dt = rN • r = instantaneous coefficient of population growth • r = b - d • Nt = N0ert • ln Nt = lnN0 + rt • r = (ln Nt– ln N0 ) / t chap.6 population ecology (I)
4 Concept of Carrying Capacity • J-shaped growth form • dN/dt = rN • sigmoid (S-shaped) growth form • dN/dt = rN x (K — N)/K • K = carrying capacity chap.6 population ecology (I)
Fig. 6-9. hypothetical examples of (A) J-shaped growth curves. chap.6 population ecology (I)
Fig. 6-9. hypothetical examples of (A) S-shaped growth curves. chap.6 population ecology (I)
Fig. 6-10. Curves showing theoretical upper and lower growth forms for any population. chap.6 population ecology (I)
Fig. 6-12. Graph depicting the various phases of the modified sigmoid growth curve. chap.6 population ecology (I)
5 Population Fluctuations and Cyclic Oscillations • Population dynamics • Seasonal changes • Annual fluctuations • Annual fluctuations, • extrinsic factors • intrinsic factors chap.6 population ecology (I)
Fig. 6-13. Irruptions of a feral house mouse (Mus musculus) population in California during 1959 and 1960. chap.6 population ecology (I)
Fig. 6-14. Fluctuations in the abundance of the lynx (Felis lynx) and the snowshoe hare (Lepus americanus), as indicated by the number of pelts received by the Hudson Bay Company. chap.6 population ecology (I)
Fig. 6-15. the snaowshoe hare (Lepus americanus), with (A) summer and (B) winter pelage. chap.6 population ecology (I)
旅鼠:resource-driven cycles 田鼠:predator-driven cycles 旅鼠 田鼠 chap.6 population ecology (I)
蛹 Fig. 6-17. Annual estimates in pupal density per m2 for the pine looper(尺蠖) (Bupalus piniaria) at Tentsmuir in Great Britain. chap.6 population ecology (I)
Extrinsic vs. intrinsic • Extrinsic factors • Gambel’s quail population in southern Arizona, winter rainfall • The northern bobwhite quail, winter snow cover and blizzard conditions • Muskrat population, drought • Intrinsic factors • Theory of stress (the general adaptation syndrome) chap.6 population ecology (I)
Fig. 6-18. Modified version of the Chitty-Krebs genetic feedback (A) hypotheses to explain population pulses in microtine rodents. chap.6 population ecology (I)
Fig. 6-18. Modified version of the Chitty-Krebs food quality (B) hypotheses to explain population pulses in microtine rodents. chap.6 population ecology (I)
Fig. 6-19. Multifactorial model of population regulaiton in the California vole (Microtus californicus). chap.6 population ecology (I)