Download
1 / 14
181 likes | 975 Views
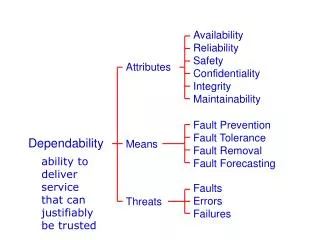
Population Attributes. Natality or birth rate. Natality is the number of births per 1000 people per year. . Natality or birth rate. Natality is the number of births per 1000 people per year. It is calculated at the mid-point of the year. . Natality or birth rate.

E N D
Natality or birth rate • Natality is the number of births per 1000 people per year.
Natality or birth rate • Natality is the number of births per 1000 people per year. • It is calculated at the mid-point of the year.
Natality or birth rate • Natality is the number of births per 1000 people per year. • It is calculated at the mid-point of the year. • In humans, natality can be calculated as a crude birth rate – the rate per 1000 members of the population.
Mortality or death rate • Mortailty is the number of deaths per 1000 people per year.
Mortality or death rate • Mortailty is the number of deaths per 1000 people per year. • Calculated at the mid-point of the year
Mortality or death rate • Mortailty is the number of deaths per 1000 people per year. • Calculated at the mid-point of the year • In humans: number of deaths per year Crude death rate = Total population X 1000
Density • Number of individuals of a population per unit of area of habitat at a specific time (wo!)
Density • Number of individuals of a population per unit of area of habitat at a specific time • EG. Human inhabitants per square km in Rotorua (2004) • EG. Pines trees per hectare in a forest in 2005
Age Structure • See handout.
Survivorship curves • Help us to study the number of organisms in a population that survive to any particular age.
Survivorship curves • Help us to study the number of organisms in a population that survive to any particular age. • The numbers are usually expressed as survivors per 1000 members of a population.
Survivorship curves • Help us to study the number of organisms in a population that survive to any particular age. • The numbers are usually expressed as survivors per 1000 members of a population. • The curves relate life expectancy to life span
Questions for Survivorship curves • How is average life expectancy measured? • What was the NZ female life expectancy 1995-1997? • Why are the ‘old humans’ life expectancy so low? • What is the general theme for life span? • Why do you think some organisms reproduce with a high number? • Why do you think mammals reproduce with a small number? • Explain in a few paragraphs what a survivorship curve is: (think of this as your summarising) – YOU NEED TO KNOW ABOUT THIS STUFF. • Draw a survivorship curve of people in a 3rd world country where life expectancy is about 30 years.